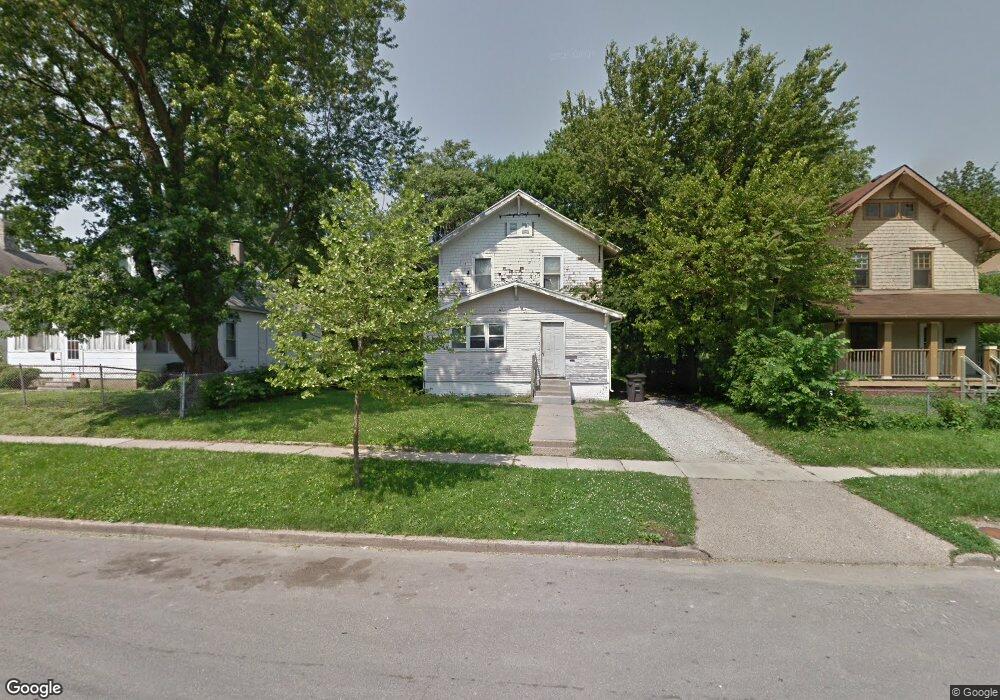
1326 18th St Des Moines, IA 50314
King Irving NeighborhoodEstimated Value: $114,000 - $209,000
3
Beds
1
Bath
1,560
Sq Ft
$96/Sq Ft
Est. Value
About This Home
This home is located at 1326 18th St, Des Moines, IA 50314 and is currently estimated at $150,331, approximately $96 per square foot. 1326 18th St is a home located in Polk County with nearby schools including King Elementary School and Roosevelt High School.
Ownership History
Date
Name
Owned For
Owner Type
Purchase Details
Closed on
Sep 20, 2008
Sold by
Ritchie Cheryll Y
Bought by
Robinson Johnathan
Current Estimated Value
Purchase Details
Closed on
Mar 7, 2003
Sold by
Kaiser Rosalie and Robinson Jonathan T
Bought by
Robinson Jonathan T and Ritchie Cheryll
Purchase Details
Closed on
Aug 26, 1997
Sold by
Robinson David Paul
Bought by
Robinson Jonathan Timothy
Purchase Details
Closed on
Jun 19, 1997
Sold by
Robinson Ruth Ellen
Bought by
Robinson Jonathan Timothy
Purchase Details
Closed on
Mar 14, 1997
Sold by
Kaiser Rosalie Jean and Kaiser Carl R
Bought by
Robinson Jonathan Timothy
Purchase Details
Closed on
Mar 13, 1997
Sold by
Robinson Teresa Eugena
Bought by
Robinson Jonathan Timothy
Purchase Details
Closed on
Feb 28, 1997
Sold by
Robinson Lloyd Ulysses and Robinson Ruth
Bought by
Robinson Jonathan Timothy
Purchase Details
Closed on
Feb 20, 1997
Sold by
Burgs Faye Helen and Burgs Emanuel
Bought by
Robinson Jonathan Timothy
Create a Home Valuation Report for This Property
The Home Valuation Report is an in-depth analysis detailing your home's value as well as a comparison with similar homes in the area
Home Values in the Area
Average Home Value in this Area
Purchase History
| Date | Buyer | Sale Price | Title Company |
|---|---|---|---|
| Robinson Johnathan | -- | None Available | |
| Robinson Jonathan T | -- | -- | |
| Robinson Jonathan Timothy | -- | -- | |
| Robinson Jonathan Timothy | -- | -- | |
| Robinson Jonathan Timothy | -- | -- | |
| Robinson Jonathan Timothy | -- | -- | |
| Robinson Jonathan Timothy | -- | -- | |
| Robinson Jonathan Timothy | -- | -- |
Source: Public Records
Tax History Compared to Growth
Tax History
| Year | Tax Paid | Tax Assessment Tax Assessment Total Assessment is a certain percentage of the fair market value that is determined by local assessors to be the total taxable value of land and additions on the property. | Land | Improvement |
|---|---|---|---|---|
| 2025 | $1,644 | $97,700 | $13,700 | $84,000 |
| 2024 | $1,644 | $83,600 | $11,700 | $71,900 |
| 2023 | $1,452 | $83,600 | $11,700 | $71,900 |
| 2022 | $1,440 | $61,600 | $8,900 | $52,700 |
| 2021 | $1,358 | $61,600 | $8,900 | $52,700 |
| 2020 | $1,410 | $54,400 | $7,900 | $46,500 |
| 2019 | $1,322 | $54,400 | $7,900 | $46,500 |
| 2018 | $1,308 | $49,200 | $7,100 | $42,100 |
| 2017 | $1,336 | $49,200 | $7,100 | $42,100 |
| 2016 | $1,302 | $49,400 | $7,100 | $42,300 |
| 2015 | $1,302 | $49,400 | $7,100 | $42,300 |
| 2014 | $1,228 | $46,200 | $7,300 | $38,900 |
Source: Public Records
Map
Nearby Homes
- 1429 Martin Luther King jr Pkwy
- 1434 Martin Luther King Junior Pkwy
- 1457 17th St
- 1303 22nd St
- 1514 Harrison Ave
- 1603 Clark St
- 1175 21st St
- 1534 18th St
- 1159 18th St
- 1414 Harrison Ave
- 2126 University Ave
- 1505 University Ave
- 1347 Forest Ave
- 1318 23rd St
- 2303 Carpenter Ave
- 1414 Goddard Ct
- 1716 Mondamin Ave
- 1622 Martin Luther King Junior Pkwy
- 1341 Clark St
- 1608 Mondamin Ave