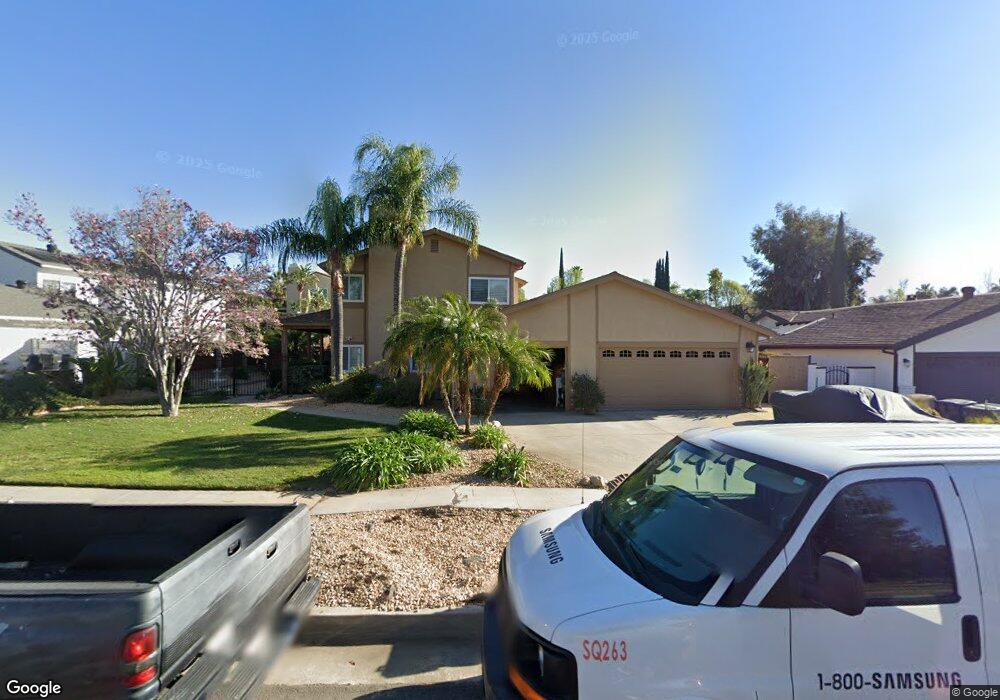
1326 Balfour Ct Redlands, CA 92374
South Redlands NeighborhoodEstimated Value: $632,928 - $744,000
4
Beds
3
Baths
2,038
Sq Ft
$340/Sq Ft
Est. Value
About This Home
This home is located at 1326 Balfour Ct, Redlands, CA 92374 and is currently estimated at $693,232, approximately $340 per square foot. 1326 Balfour Ct is a home located in San Bernardino County with nearby schools including Mariposa Elementary School, Moore Middle School, and Redlands East Valley High School.
Ownership History
Date
Name
Owned For
Owner Type
Purchase Details
Closed on
Nov 5, 2014
Sold by
Diaz John R and Diaz Ramona
Bought by
John R Diaz & Ramona Diaz Revocable Trus
Current Estimated Value
Purchase Details
Closed on
Sep 22, 1998
Sold by
Allen Thomas E and Allen Louise T
Bought by
Diaz John R and Diaz Ramona
Home Financials for this Owner
Home Financials are based on the most recent Mortgage that was taken out on this home.
Original Mortgage
$137,600
Outstanding Balance
$29,113
Interest Rate
6.79%
Estimated Equity
$664,119
Create a Home Valuation Report for This Property
The Home Valuation Report is an in-depth analysis detailing your home's value as well as a comparison with similar homes in the area
Home Values in the Area
Average Home Value in this Area
Purchase History
| Date | Buyer | Sale Price | Title Company |
|---|---|---|---|
| John R Diaz & Ramona Diaz Revocable Trus | -- | None Available | |
| Diaz John R | $172,000 | Chicago Title |
Source: Public Records
Mortgage History
| Date | Status | Borrower | Loan Amount |
|---|---|---|---|
| Open | Diaz John R | $137,600 |
Source: Public Records
Tax History Compared to Growth
Tax History
| Year | Tax Paid | Tax Assessment Tax Assessment Total Assessment is a certain percentage of the fair market value that is determined by local assessors to be the total taxable value of land and additions on the property. | Land | Improvement |
|---|---|---|---|---|
| 2025 | $3,069 | $269,655 | $67,414 | $202,241 |
| 2024 | $3,069 | $264,367 | $66,092 | $198,275 |
| 2023 | $3,064 | $259,183 | $64,796 | $194,387 |
| 2022 | $3,018 | $254,100 | $63,525 | $190,575 |
| 2021 | $3,071 | $249,117 | $62,279 | $186,838 |
| 2020 | $3,025 | $246,562 | $61,640 | $184,922 |
| 2019 | $2,939 | $241,727 | $60,431 | $181,296 |
| 2018 | $2,864 | $236,987 | $59,246 | $177,741 |
| 2017 | $2,839 | $232,340 | $58,084 | $174,256 |
| 2016 | $2,805 | $227,784 | $56,945 | $170,839 |
| 2015 | $2,783 | $224,363 | $56,090 | $168,273 |
| 2014 | $2,732 | $219,968 | $54,991 | $164,977 |
Source: Public Records
Map
Nearby Homes
- 743 Mcauliffe Ct
- 1432 Moore St
- Belmont Plan at Havenwood
- Camden Plan at Havenwood
- Lexington Plan at Havenwood
- Windsor Plan at Havenwood
- 1200 E Highland Ave Unit 207
- 1438 Moore St
- 1033 Evergreen Ct
- 1442 Moore St
- 1446 Moore St
- 110 Judson St
- 1410 Pleasantview Dr
- 149 Lido St
- 1502 Marion Rd
- 217 Judson St
- 1556 Gary Ln
- 1563 Gary Ln
- 1427 Laramie Ave
- 56 Dearborn Cir