Estimated Value: $315,000 - $355,727
3
Beds
2
Baths
1,020
Sq Ft
$334/Sq Ft
Est. Value
About This Home
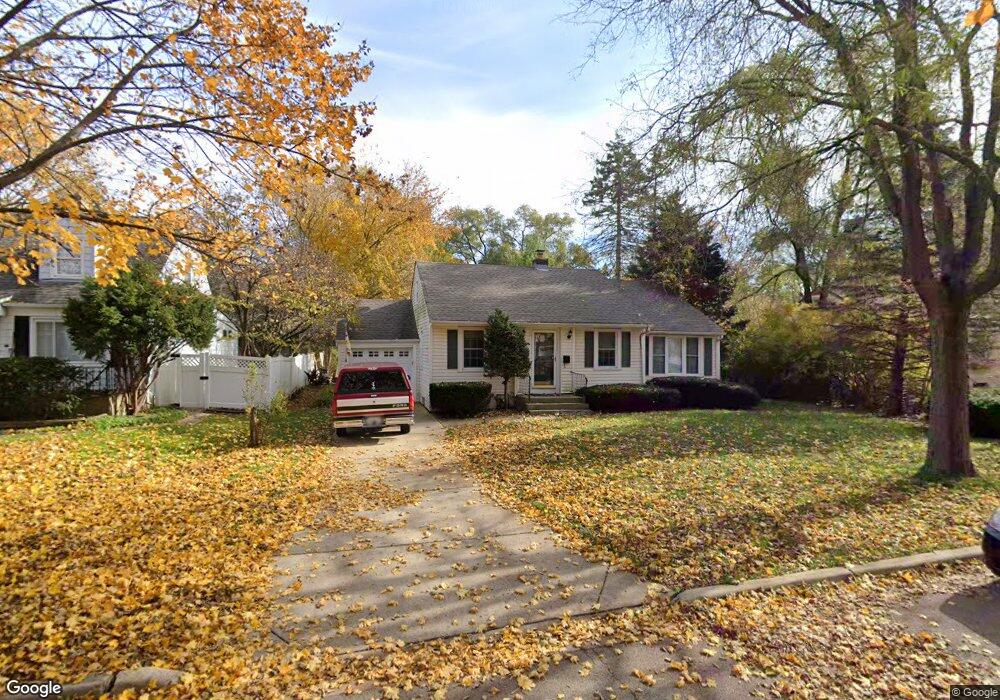
This home is located at 1326 Elm St, Saint Charles, IL 60174 and is currently estimated at $340,682, approximately $334 per square foot. 1326 Elm St is a home located in Kane County with nearby schools including Davis Primary School, Richmond Intermediate School, and Thompson Middle School.
Ownership History
Date
Name
Owned For
Owner Type
Purchase Details
Closed on
Oct 9, 2017
Sold by
Mccormick Suzanne M and The Estate Of William Charles
Bought by
Mccormick Suzanne M and Family Trust Under The Last Wi
Current Estimated Value
Purchase Details
Closed on
Jan 10, 2002
Sold by
Mccormick Suzanne M
Bought by
Mccormick Suzanne M and Mccormick William C
Home Financials for this Owner
Home Financials are based on the most recent Mortgage that was taken out on this home.
Original Mortgage
$134,400
Outstanding Balance
$55,039
Interest Rate
7.07%
Estimated Equity
$285,643
Purchase Details
Closed on
Jun 29, 2001
Sold by
Streich Steven J and Streich Franca V
Bought by
Mccormick Suzanne M
Purchase Details
Closed on
Apr 24, 1998
Sold by
Stantus Luella F
Bought by
Streich Steven J and Streich Franca F
Home Financials for this Owner
Home Financials are based on the most recent Mortgage that was taken out on this home.
Original Mortgage
$113,350
Interest Rate
7.26%
Create a Home Valuation Report for This Property
The Home Valuation Report is an in-depth analysis detailing your home's value as well as a comparison with similar homes in the area
Home Values in the Area
Average Home Value in this Area
Purchase History
| Date | Buyer | Sale Price | Title Company |
|---|---|---|---|
| Mccormick Suzanne M | -- | Attorney | |
| Mccormick Suzanne M | -- | Chicago Title Insurance Co | |
| Mccormick Suzanne M | $168,000 | First American Title | |
| Streich Steven J | $126,500 | Fox Title Company |
Source: Public Records
Mortgage History
| Date | Status | Borrower | Loan Amount |
|---|---|---|---|
| Open | Mccormick Suzanne M | $134,400 | |
| Previous Owner | Streich Steven J | $113,350 |
Source: Public Records
Tax History Compared to Growth
Tax History
| Year | Tax Paid | Tax Assessment Tax Assessment Total Assessment is a certain percentage of the fair market value that is determined by local assessors to be the total taxable value of land and additions on the property. | Land | Improvement |
|---|---|---|---|---|
| 2024 | $7,408 | $99,799 | $37,240 | $62,559 |
| 2023 | $7,149 | $89,321 | $33,330 | $55,991 |
| 2022 | $6,813 | $84,377 | $32,835 | $51,542 |
| 2021 | $6,560 | $80,428 | $31,298 | $49,130 |
| 2020 | $6,496 | $78,928 | $30,714 | $48,214 |
| 2019 | $6,385 | $77,365 | $30,106 | $47,259 |
| 2018 | $6,045 | $72,878 | $27,334 | $45,544 |
| 2017 | $5,898 | $70,386 | $26,399 | $43,987 |
| 2016 | $6,204 | $67,914 | $25,472 | $42,442 |
| 2015 | -- | $64,417 | $25,197 | $39,220 |
| 2014 | -- | $61,389 | $25,197 | $36,192 |
| 2013 | -- | $62,201 | $25,449 | $36,752 |
Source: Public Records
Map
Nearby Homes
- 82 Gray St
- 1008 Pine St
- 1028 S 5th St
- 629 N Lincoln Ave
- Lot 2 Geneva Rd
- Lot 1 Geneva Rd
- 885 Geneva Rd
- Lot 1 Keller Place
- 1017 S 6th St
- 806 Fellows St
- 2749 Stone Cir
- 2753 Stone Cir
- 2747 Stone Cir
- 2751 Stone Cir
- 839 N Bennett St
- 10 Ford St Unit 103
- 311 Ohio Ave
- 1108 S 12th St Unit 2
- 602 Highbury Ln
- 10 Illinois St Unit 5A