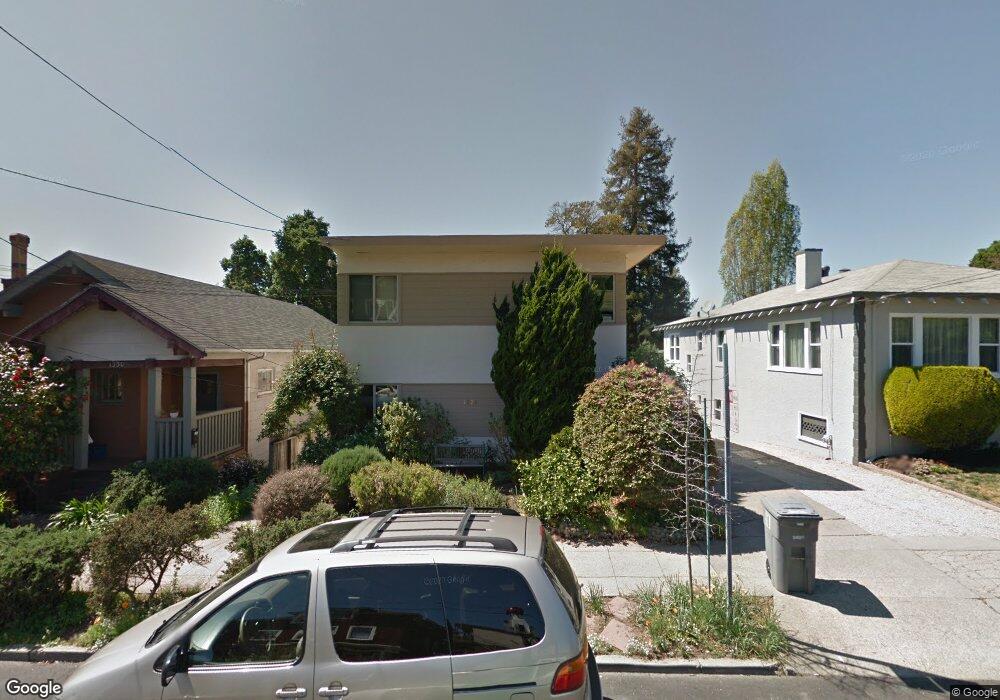
1326 Milvia St Unit A Berkeley, CA 94709
North Berkeley NeighborhoodEstimated Value: $594,000 - $957,000
2
Beds
1
Bath
768
Sq Ft
$949/Sq Ft
Est. Value
About This Home
This home is located at 1326 Milvia St Unit A, Berkeley, CA 94709 and is currently estimated at $728,770, approximately $948 per square foot. 1326 Milvia St Unit A is a home located in Alameda County with nearby schools including Berkeley Arts Magnet at Whittier School, Cragmont Elementary School, and Washington Elementary School.
Ownership History
Date
Name
Owned For
Owner Type
Purchase Details
Closed on
Feb 27, 2007
Sold by
Thompson Kirk
Bought by
Thompson Kirk S and The Kirk S Thompson Trust
Current Estimated Value
Purchase Details
Closed on
Jan 27, 1999
Sold by
Luebben Thomas E and Luebben Elizabet David
Bought by
Thompson Kirk
Home Financials for this Owner
Home Financials are based on the most recent Mortgage that was taken out on this home.
Original Mortgage
$75,000
Outstanding Balance
$17,737
Interest Rate
6.73%
Estimated Equity
$711,033
Purchase Details
Closed on
Apr 26, 1994
Sold by
France Jaconette Patricia W and France Wade Gail
Bought by
Luebben Thomas E and Alpert David D
Home Financials for this Owner
Home Financials are based on the most recent Mortgage that was taken out on this home.
Original Mortgage
$108,800
Interest Rate
7.84%
Create a Home Valuation Report for This Property
The Home Valuation Report is an in-depth analysis detailing your home's value as well as a comparison with similar homes in the area
Home Values in the Area
Average Home Value in this Area
Purchase History
We collect this data history from publicly available records. To have your information removed, we recommend requesting removal directly through your county’s website.
| Date | Buyer | Sale Price | Title Company |
|---|---|---|---|
| Thompson Kirk S | -- | None Available | |
| Thompson Kirk | $175,000 | Old Republic Title Company | |
| Luebben Thomas E | $136,000 | Placer Title Company |
Source: Public Records
Mortgage History
We collect this data history from publicly available records. To have your information removed, we recommend requesting removal directly through your county’s website.
| Date | Status | Borrower | Loan Amount |
|---|---|---|---|
| Open | Thompson Kirk | $75,000 | |
| Previous Owner | Luebben Thomas E | $108,800 |
Source: Public Records
Tax History
| Year | Tax Paid | Tax Assessment Tax Assessment Total Assessment is a certain percentage of the fair market value that is determined by local assessors to be the total taxable value of land and additions on the property. | Land | Improvement |
|---|---|---|---|---|
| 2025 | $5,008 | $267,333 | $82,300 | $192,033 |
| 2024 | $5,008 | $261,955 | $80,686 | $188,269 |
| 2023 | $4,892 | $263,682 | $79,104 | $184,578 |
| 2022 | $4,783 | $251,513 | $77,554 | $180,959 |
| 2021 | $4,777 | $246,444 | $76,033 | $177,411 |
| 2020 | $4,486 | $250,846 | $75,254 | $175,592 |
| 2019 | $4,266 | $245,928 | $73,778 | $172,150 |
| 2018 | $4,182 | $241,107 | $72,332 | $168,775 |
| 2017 | $4,015 | $236,380 | $70,914 | $165,466 |
| 2016 | $3,851 | $231,747 | $69,524 | $162,223 |
| 2015 | $3,794 | $228,265 | $68,479 | $159,786 |
| 2014 | $3,755 | $223,794 | $67,138 | $156,656 |
Source: Public Records
Map
Nearby Homes
- 1340 Henry St
- 1408 Henry St
- 1425 Martin Luther King jr Way
- 1444 Walnut St
- 1841 Vine St
- 1511 Grant St
- 1609 Bonita Ave Unit 5
- 1545 Josephine St
- 1429 Edith St
- 1490 Arch St
- 1643 Walnut St
- 1682 Oxford St
- 1994 Marin Ave
- 2301 Oak St
- 1734 Spruce St
- 2301 Virginia St Unit 1
- 2501 Rose Walk
- 1739 Spruce St
- 2340 Virginia St
- 1906 Delaware St
- 1333 Milvia St Unit A
- 1331 Milvia St Unit C
- 1329 Milvia St Unit B
- 1327 Milvia St
- 1335 Milvia St
- 1325 Milvia St
- 1339 Milvia St
- 1341 Milvia St
- 1330 Milvia St
- 1321 Milvia St
- 1321 Milvia St Unit 1321
- 1360 Henry St
- 1376 Henry St
- 1336 Milvia St Unit B
- 1336 Milvia St Unit A
- 1338 Milvia St
- 1338 Milvia St Unit A
- 1336 Milvia St
- 1326 Milvia St Unit D
- 1326 Milvia St Unit B
Your Personal Tour Guide
Ask me questions while you tour the home.