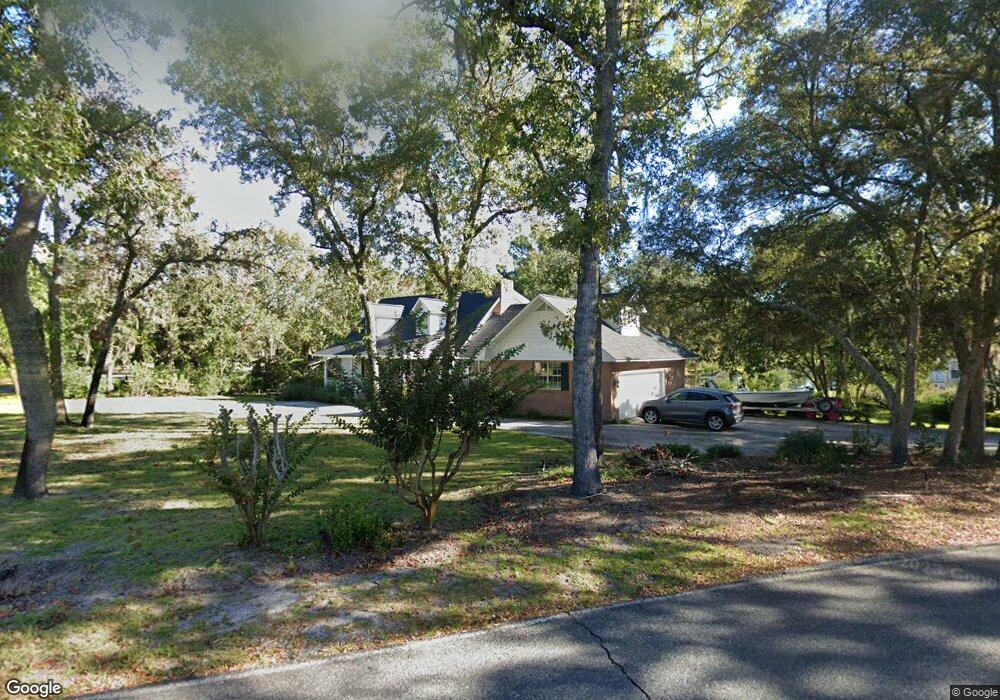
1326 N River Oaks Dr Blackshear, GA 31516
Estimated Value: $415,498 - $457,000
3
Beds
3
Baths
3,128
Sq Ft
$140/Sq Ft
Est. Value
About This Home
This home is located at 1326 N River Oaks Dr, Blackshear, GA 31516 and is currently estimated at $437,125, approximately $139 per square foot. 1326 N River Oaks Dr is a home located in Pierce County with nearby schools including Pierce County High School.
Ownership History
Date
Name
Owned For
Owner Type
Purchase Details
Closed on
Jun 17, 2011
Sold by
Prime South Bank
Bought by
Redick Amelia M and Redick James Harold
Current Estimated Value
Home Financials for this Owner
Home Financials are based on the most recent Mortgage that was taken out on this home.
Original Mortgage
$149,575
Outstanding Balance
$102,369
Interest Rate
4.63%
Mortgage Type
New Conventional
Estimated Equity
$334,756
Purchase Details
Closed on
Dec 1, 2009
Sold by
Gibson Taylor Lamar
Bought by
Primesouth Bank
Purchase Details
Closed on
Oct 5, 2007
Sold by
Cox Laura Pickett
Bought by
Gibson Taylor
Purchase Details
Closed on
Feb 14, 2007
Sold by
Pickett Carl K
Bought by
Pickett Annie Ruth and Cox Laura Pickett
Purchase Details
Closed on
Jan 26, 1989
Sold by
Okefenokee Golf Club Inc
Bought by
Pickett Carl
Purchase Details
Closed on
Nov 20, 1975
Sold by
Shields John A
Bought by
Okefenokee Golf Club Inc
Create a Home Valuation Report for This Property
The Home Valuation Report is an in-depth analysis detailing your home's value as well as a comparison with similar homes in the area
Home Values in the Area
Average Home Value in this Area
Purchase History
| Date | Buyer | Sale Price | Title Company |
|---|---|---|---|
| Redick Amelia M | $155,000 | -- | |
| Primesouth Bank | -- | -- | |
| Gibson Taylor | $295,000 | -- | |
| Pickett Annie Ruth | -- | -- | |
| Pickett Carl | $12,000 | -- | |
| Okefenokee Golf Club Inc | $110,000 | -- |
Source: Public Records
Mortgage History
| Date | Status | Borrower | Loan Amount |
|---|---|---|---|
| Open | Redick Amelia M | $149,575 | |
| Closed | Gibson Taylor | $0 |
Source: Public Records
Tax History Compared to Growth
Tax History
| Year | Tax Paid | Tax Assessment Tax Assessment Total Assessment is a certain percentage of the fair market value that is determined by local assessors to be the total taxable value of land and additions on the property. | Land | Improvement |
|---|---|---|---|---|
| 2025 | $3,399 | $147,331 | $28,000 | $119,331 |
| 2024 | $3,399 | $145,062 | $28,000 | $117,062 |
| 2023 | $3,379 | $144,225 | $28,000 | $116,225 |
| 2022 | $2,914 | $107,855 | $13,107 | $94,748 |
| 2021 | $2,756 | $103,990 | $13,107 | $90,883 |
| 2020 | $2,695 | $100,125 | $13,107 | $87,018 |
| 2019 | $2,714 | $100,125 | $13,107 | $87,018 |
| 2018 | $2,602 | $96,260 | $13,107 | $83,153 |
| 2017 | $2,561 | $93,214 | $13,107 | $80,107 |
| 2016 | $2,541 | $93,214 | $13,107 | $80,107 |
| 2015 | $2,474 | $93,214 | $13,107 | $80,107 |
| 2014 | $2,474 | $93,214 | $13,107 | $80,107 |
| 2013 | $2,474 | $93,214 | $13,106 | $80,107 |
Source: Public Records
Map
Nearby Homes
- 6121 Fairway Oaks Way
- 1344 River Landing Way
- 6005 & 6007 Tree Top Ln
- 6223 Palmetto Way
- 6435 Riverwoods Dr
- 5927 Yellow Bluff Rd
- 06 Alton Cir
- 03 Alton Cir
- 02 Alton Cir
- 04 Alton Cir
- 01 Alton Cir
- 5768 Holly Dr
- 5802 River Trail
- 5641 Fleetwood Ln
- 1621 Meadowood Dr
- 1691 Huckaby Rd
- 5627 Yellow Bluff Rd
- 0 Ash Dr
- 2784 Autumn Ridge Ln
- 2959 Chadwick Dr
- 6054 Ridge Trace
- 1338 N River Oaks Dr
- 1323 N River Oaks Dr
- 1333 N River Oaks Dr
- 6038 Ridge Trace
- 1313 N River Oaks Dr
- 1306 N River Oaks Dr
- 106 Ping Ct
- 1346 N River Oaks Dr
- 1349 N River Oaks Dr
- 6026 Ridge Trace
- 6045 Ridge Trace
- 1303 N River Oaks Dr
- 6041 Ridge Trace
- 1358 N River Oaks Dr
- 6018 Ridge Trace
- 6029 Ridge Trace
- 1357 N River Oaks Dr
- 6029 Ridge Trace Rd
- 6018 Ridge Trace Rd