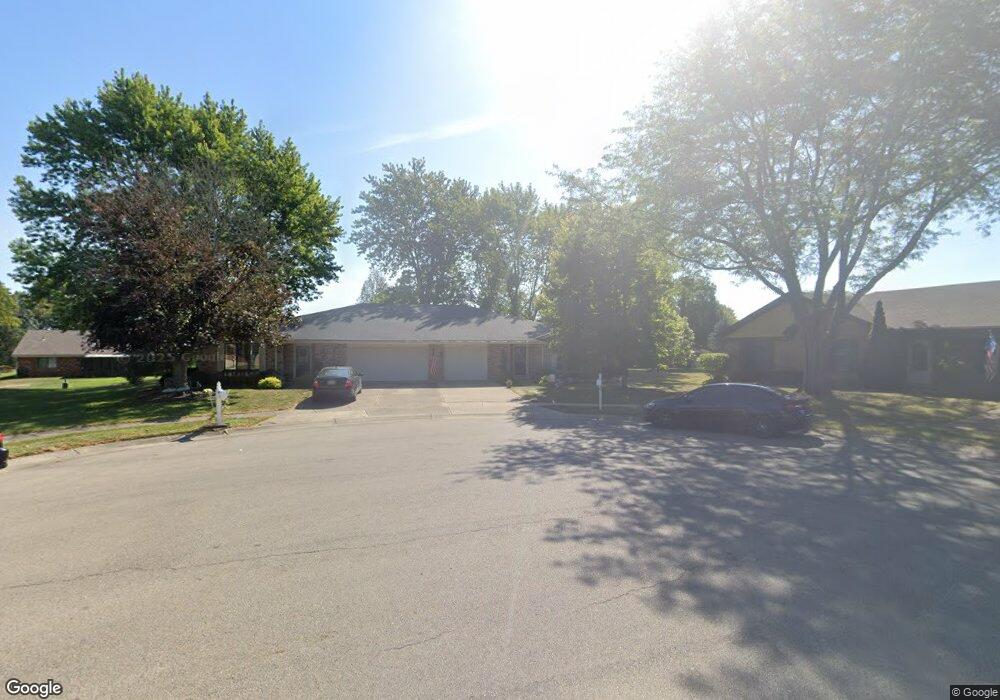
1326 Rosehaven Cir Dayton, OH 45429
Estimated Value: $346,292 - $436,000
4
Beds
4
Baths
3,336
Sq Ft
$117/Sq Ft
Est. Value
About This Home
This home is located at 1326 Rosehaven Cir, Dayton, OH 45429 and is currently estimated at $389,323, approximately $116 per square foot. 1326 Rosehaven Cir is a home located in Montgomery County with nearby schools including John F. Kennedy Elementary School, Kettering Middle School, and Kettering Fairmont High School.
Ownership History
Date
Name
Owned For
Owner Type
Purchase Details
Closed on
Aug 2, 2022
Sold by
Linda K Trumble Revocable Living Trust
Bought by
Green Jeffrey Paul
Current Estimated Value
Purchase Details
Closed on
Sep 11, 2015
Sold by
Pruett Gail A
Bought by
Trumble Linda Kay
Home Financials for this Owner
Home Financials are based on the most recent Mortgage that was taken out on this home.
Original Mortgage
$150,000
Interest Rate
3.84%
Mortgage Type
New Conventional
Purchase Details
Closed on
Jan 2, 2003
Sold by
Buschor Mildred E
Bought by
James Ernest S and Pruett Gail A
Create a Home Valuation Report for This Property
The Home Valuation Report is an in-depth analysis detailing your home's value as well as a comparison with similar homes in the area
Home Values in the Area
Average Home Value in this Area
Purchase History
| Date | Buyer | Sale Price | Title Company |
|---|---|---|---|
| Green Jeffrey Paul | -- | -- | |
| Trumble Linda Kay | $206,000 | Attorney | |
| James Ernest S | $208,000 | -- |
Source: Public Records
Mortgage History
| Date | Status | Borrower | Loan Amount |
|---|---|---|---|
| Previous Owner | Trumble Linda Kay | $150,000 |
Source: Public Records
Tax History Compared to Growth
Tax History
| Year | Tax Paid | Tax Assessment Tax Assessment Total Assessment is a certain percentage of the fair market value that is determined by local assessors to be the total taxable value of land and additions on the property. | Land | Improvement |
|---|---|---|---|---|
| 2024 | $5,690 | $89,630 | $13,230 | $76,400 |
| 2023 | $5,690 | $89,630 | $13,230 | $76,400 |
| 2022 | $5,705 | $71,110 | $10,500 | $60,610 |
| 2021 | $5,286 | $71,110 | $10,500 | $60,610 |
| 2020 | $5,302 | $71,110 | $10,500 | $60,610 |
| 2019 | $6,072 | $72,100 | $10,500 | $61,600 |
| 2018 | $6,105 | $72,100 | $10,500 | $61,600 |
| 2017 | $5,637 | $72,100 | $10,500 | $61,600 |
| 2016 | $5,996 | $72,100 | $10,500 | $61,600 |
| 2015 | $4,130 | $61,880 | $10,500 | $51,380 |
| 2014 | $4,130 | $61,880 | $10,500 | $51,380 |
| 2012 | -- | $68,000 | $11,550 | $56,450 |
Source: Public Records
Map
Nearby Homes
- 1310 Partridge Run Cir Unit 1310
- 5155 Marshall Rd
- 4640 Marshall Rd
- 1049 Georgian Dr
- 730 Hyde Park Dr
- 5440 Royalwood Dr
- 1328 Willowdale Ave
- 4307 Meadowcroft Rd
- 5536 Durwood St
- 5536 Durwood Rd
- 5417 Red Coach Rd
- 4244 Flowerdale Ave
- 1008 Rio Ln
- 4817 Ackerman Blvd
- 321 Princewood Ave
- 5017 Ackerman Blvd
- 2021 Stayman Dr
- 5526 Red Coach Rd
- 1013 Swango Dr
- 617 Laurelann Dr
- 1328 Rosehaven Cir
- 4925 Foxdale Dr Unit 1
- 4927 Foxdale Dr
- 4927 Foxdale Dr Unit 2
- 4927 Foxdale Dr Unit 2
- 4937 Foxdale Dr Unit 4937
- 4913 Foxdale Dr
- 1314 Rosehaven Cir
- 4939 Foxdale Dr
- 4939 Foxdale Dr Unit 4939
- 1265 Donson Cir Unit 1265126
- 1261 Donson Cir Unit 1261126
- 4901 Foxdale Dr
- 1253 Donson Dr
- 1245 Donson Dr
- 1337 Rosehaven Cir
- 4948 Foxdale Dr
- 4948 Foxdale Dr Unit 1
- 4924 Foxdale Dr
- 4936 Foxdale Dr