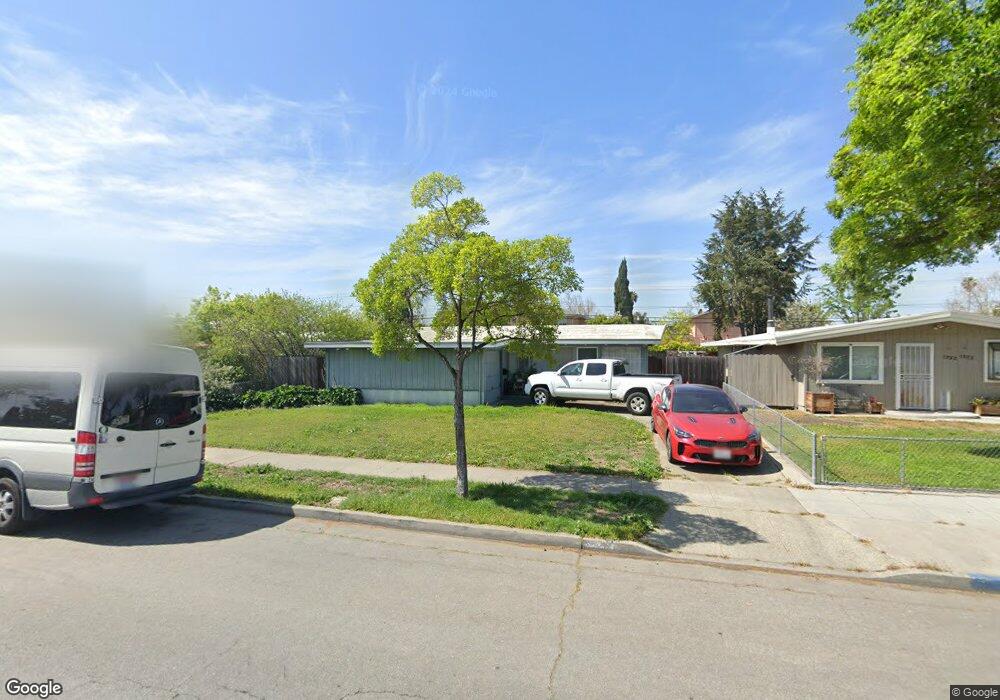
1326 Sandia Ave Sunnyvale, CA 94089
Lakewood NeighborhoodEstimated Value: $1,398,000 - $1,643,000
3
Beds
2
Baths
1,000
Sq Ft
$1,521/Sq Ft
Est. Value
About This Home
This home is located at 1326 Sandia Ave, Sunnyvale, CA 94089 and is currently estimated at $1,520,944, approximately $1,520 per square foot. 1326 Sandia Ave is a home located in Santa Clara County with nearby schools including Fairwood Elementary School, Columbia Middle School, and Fremont High School.
Ownership History
Date
Name
Owned For
Owner Type
Purchase Details
Closed on
Sep 22, 2000
Sold by
Mcneal Lynn Patricia
Bought by
Rojo Steven S
Current Estimated Value
Home Financials for this Owner
Home Financials are based on the most recent Mortgage that was taken out on this home.
Original Mortgage
$252,700
Outstanding Balance
$91,186
Interest Rate
7.96%
Estimated Equity
$1,429,758
Purchase Details
Closed on
May 20, 1997
Sold by
Mcneal Valerie Ann
Bought by
Mcneal Lynn Patricia
Purchase Details
Closed on
Apr 17, 1996
Sold by
Turner Paul Albert and Mcneal Milton J
Bought by
Mcneal Lynn Patricia
Purchase Details
Closed on
Mar 29, 1996
Sold by
Turner Paul Albert and Mcneal Floy T
Bought by
Turner Paul Albert and Mcneal Milton J
Create a Home Valuation Report for This Property
The Home Valuation Report is an in-depth analysis detailing your home's value as well as a comparison with similar homes in the area
Home Values in the Area
Average Home Value in this Area
Purchase History
| Date | Buyer | Sale Price | Title Company |
|---|---|---|---|
| Rojo Steven S | $335,000 | North American Title Co | |
| Mcneal Lynn Patricia | -- | Old Republic Title Company | |
| Mcneal Lynn Patricia | -- | Old Republic Title Company | |
| Mcneal Lynn Patricia | -- | -- | |
| Turner Paul Albert | $52,000 | -- |
Source: Public Records
Mortgage History
| Date | Status | Borrower | Loan Amount |
|---|---|---|---|
| Open | Rojo Steven S | $252,700 |
Source: Public Records
Tax History Compared to Growth
Tax History
| Year | Tax Paid | Tax Assessment Tax Assessment Total Assessment is a certain percentage of the fair market value that is determined by local assessors to be the total taxable value of land and additions on the property. | Land | Improvement |
|---|---|---|---|---|
| 2025 | $6,862 | $590,661 | $527,386 | $63,275 |
| 2024 | $6,862 | $579,081 | $517,046 | $62,035 |
| 2023 | $6,798 | $567,727 | $506,908 | $60,819 |
| 2022 | $6,694 | $556,596 | $496,969 | $59,627 |
| 2021 | $6,629 | $545,683 | $487,225 | $58,458 |
| 2020 | $6,545 | $540,089 | $482,230 | $57,859 |
| 2019 | $6,401 | $529,500 | $472,775 | $56,725 |
| 2018 | $6,273 | $519,118 | $463,505 | $55,613 |
| 2017 | $6,192 | $508,940 | $454,417 | $54,523 |
| 2016 | $5,950 | $498,961 | $445,507 | $53,454 |
| 2015 | $5,981 | $491,468 | $438,816 | $52,652 |
| 2014 | $5,864 | $481,842 | $430,221 | $51,621 |
Source: Public Records
Map
Nearby Homes
- 1269 Manzano Way
- 1199 Blazingwood Dr
- 1101 Palamos Ave
- 1017 Lakedale Way
- 1189 Skylake Ct
- 962 E Duane Ave
- 1220 Tasman Dr Unit 7
- 1220 Tasman Dr Unit 432
- 1220 Tasman Dr
- 1220 Tasman Dr Unit 128
- 1220 Tasman Dr Unit 558
- 1220 Tasman Dr Unit 304
- 1220 Tasman Dr Unit 124
- 1220 Tasman Dr Unit 39
- 774 Lakewood Dr
- 959 Highland Terrace
- 754 Lakehaven Dr
- 930 Highland Terrace
- 750 San Ramon Ave
- 1225 Vienna Dr Unit 937
- 1330 Sandia Ave
- 1322 Sandia Ave
- 1329 Socorro Ave
- 1334 Sandia Ave
- 1325 Socorro Ave
- 1318 Sandia Ave
- 1333 Socorro Ave
- 1319 Socorro Ave
- 1338 Sandia Ave
- 1337 Socorro Ave
- 1314 Sandia Ave
- 1327 Sandia Ave
- 1323 Sandia Ave
- 1331 Sandia Ave
- 1313 Socorro Ave
- 1319 Sandia Ave
- 1335 Sandia Ave
- 1341 Socorro Ave
- 1342 Sandia Ave
- 1310 Sandia Ave