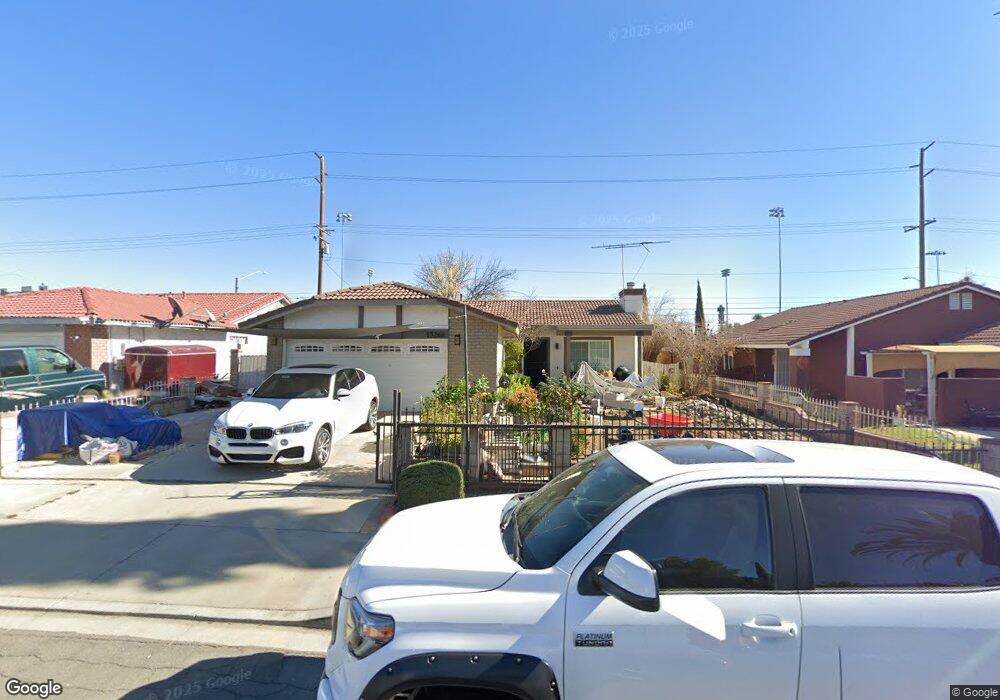
13266 Oak Dell St Moreno Valley, CA 92553
Towngate NeighborhoodEstimated Value: $464,219 - $525,000
4
Beds
2
Baths
1,351
Sq Ft
$371/Sq Ft
Est. Value
About This Home
This home is located at 13266 Oak Dell St, Moreno Valley, CA 92553 and is currently estimated at $500,555, approximately $370 per square foot. 13266 Oak Dell St is a home located in Riverside County with nearby schools including Towngate Elementary School, Sunnymead Middle School, and Moreno Valley High School.
Ownership History
Date
Name
Owned For
Owner Type
Purchase Details
Closed on
Sep 4, 2012
Sold by
Pham Dahn Ngoc and Bui Loan Thi Kim
Bought by
Pham Khang N
Current Estimated Value
Purchase Details
Closed on
Sep 19, 1998
Sold by
Pham Danh N
Bought by
Pham Danh Ngoc and Bui Kim Loan
Home Financials for this Owner
Home Financials are based on the most recent Mortgage that was taken out on this home.
Original Mortgage
$72,000
Interest Rate
6.88%
Purchase Details
Closed on
Apr 17, 1995
Sold by
Bui Loan T Kim
Bought by
Pham Danh Ngoc
Home Financials for this Owner
Home Financials are based on the most recent Mortgage that was taken out on this home.
Original Mortgage
$76,000
Interest Rate
8.51%
Purchase Details
Closed on
Apr 14, 1995
Sold by
Austin Orvester and Austin Mary J
Bought by
Pham Danh Ngoc
Home Financials for this Owner
Home Financials are based on the most recent Mortgage that was taken out on this home.
Original Mortgage
$76,000
Interest Rate
8.51%
Create a Home Valuation Report for This Property
The Home Valuation Report is an in-depth analysis detailing your home's value as well as a comparison with similar homes in the area
Home Values in the Area
Average Home Value in this Area
Purchase History
| Date | Buyer | Sale Price | Title Company |
|---|---|---|---|
| Pham Khang N | -- | None Available | |
| Pham Danh Ngoc | -- | Landsafe Title | |
| Pham Danh Ngoc | -- | Chicago Title Company | |
| Pham Danh Ngoc | $86,000 | Chicago Title Company |
Source: Public Records
Mortgage History
| Date | Status | Borrower | Loan Amount |
|---|---|---|---|
| Closed | Pham Danh Ngoc | $72,000 | |
| Closed | Pham Danh Ngoc | $76,000 |
Source: Public Records
Tax History Compared to Growth
Tax History
| Year | Tax Paid | Tax Assessment Tax Assessment Total Assessment is a certain percentage of the fair market value that is determined by local assessors to be the total taxable value of land and additions on the property. | Land | Improvement |
|---|---|---|---|---|
| 2025 | $1,667 | $144,408 | $58,766 | $85,642 |
| 2023 | $1,667 | $138,802 | $56,485 | $82,317 |
| 2022 | $1,604 | $136,081 | $55,378 | $80,703 |
| 2021 | $1,575 | $133,414 | $54,293 | $79,121 |
| 2020 | $1,558 | $132,047 | $53,737 | $78,310 |
| 2019 | $1,532 | $129,459 | $52,684 | $76,775 |
| 2018 | $1,503 | $126,921 | $51,651 | $75,270 |
| 2017 | $1,470 | $124,434 | $50,639 | $73,795 |
| 2016 | $1,455 | $121,996 | $49,647 | $72,349 |
| 2015 | $1,434 | $120,165 | $48,902 | $71,263 |
| 2014 | $1,340 | $117,813 | $47,945 | $69,868 |
Source: Public Records
Map
Nearby Homes
- 13241 Oak Dell St
- 22926 Scribner Dr
- 13316 Pan am Blvd
- 13126 Kiowa Dr
- 13162 Brentwood Ln
- 23161 Denver Ct
- 22677 Westlake Dr
- 22959 Vought St
- 13100 Palisade Place
- 23314 Lena St
- 22936 Allies Place
- 22850 Allies Place
- 22790 Allies Place
- 13122 Westminster Ln
- 23395 Old Valley Dr
- 12579 Penske St
- 13844 Boeing St
- 22350 Yorke Rd Unit 18
- 23211 Park Valley Dr
- 23621 Suncrest Ave
- 13280 Oak Dell St
- 13250 Oak Dell St
- 13296 Oak Dell St
- 22975 Dracaea Ave
- 13310 Oak Dell St
- 13240 Oak Dell St
- 13281 Oak Dell St
- 13297 Oak Dell St
- 22961 Dracaea Ave
- 13230 Oak Dell St
- 13326 Oak Dell St
- 13311 Oak Dell St
- 13220 Oak Dell St
- 13231 Oak Dell St
- 22947 Dracaea Ave
- 13327 Oak Dell St
- 13221 Oak Dell St
- 13340 Oak Dell St
- 13296 Appleby Ct
- 13214 Oak Dell St