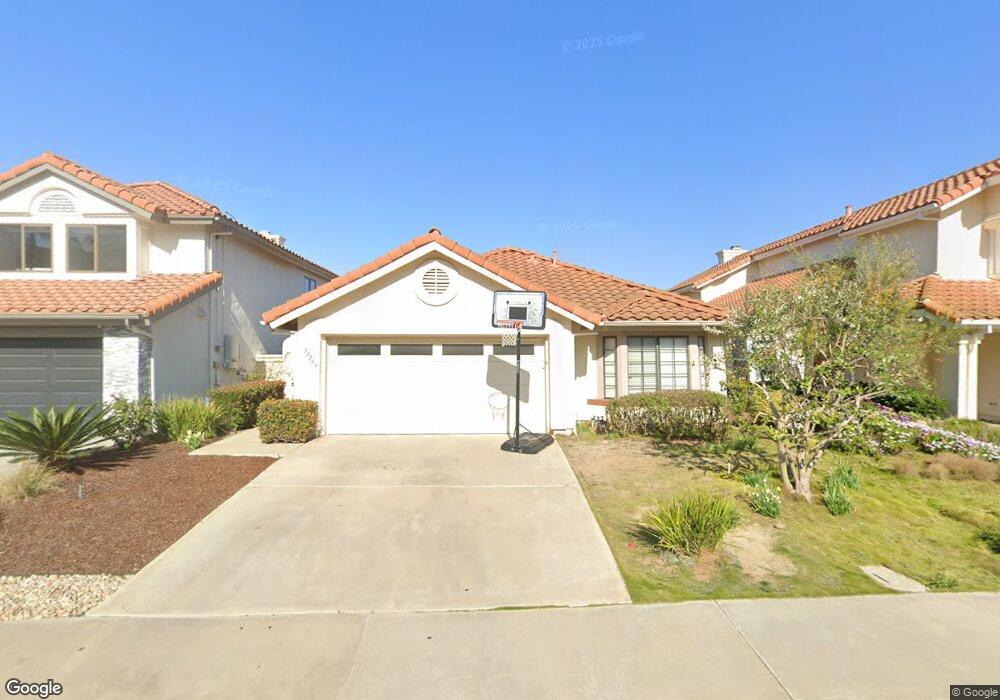
13266 Ocean Vista Rd San Diego, CA 92130
Carmel Valley NeighborhoodEstimated Value: $1,700,206 - $2,223,000
3
Beds
2
Baths
1,620
Sq Ft
$1,211/Sq Ft
Est. Value
About This Home
This home is located at 13266 Ocean Vista Rd, San Diego, CA 92130 and is currently estimated at $1,961,302, approximately $1,210 per square foot. 13266 Ocean Vista Rd is a home located in San Diego County with nearby schools including Solana Highlands Elementary School, Carmel Valley Middle School, and Torrey Pines High School.
Ownership History
Date
Name
Owned For
Owner Type
Purchase Details
Closed on
Nov 29, 2018
Sold by
Eck Victoria Boyer and Eck Living Trust
Bought by
Eck Victoria Boyer and Trust A Of The Eck Living Trus
Current Estimated Value
Purchase Details
Closed on
May 6, 2016
Sold by
Eck Victoria Boyer
Bought by
Eck Living Trust and Eck Victoria Susan Boyer
Purchase Details
Closed on
Mar 25, 2016
Sold by
Boyer Gregory Vaitl
Bought by
Eck Victoria Boyer
Purchase Details
Closed on
Mar 23, 2016
Sold by
Boyer Alice V
Bought by
Boyer Gregory Vaitl and Eck Victoria Boyer
Purchase Details
Closed on
Jan 11, 1996
Sold by
Boyer Family Trust 12-18-81 and Alice V
Bought by
Boyer Alice
Purchase Details
Closed on
Jul 26, 1993
Sold by
Boyer Alice V
Bought by
Boyer Alice
Home Financials for this Owner
Home Financials are based on the most recent Mortgage that was taken out on this home.
Original Mortgage
$120,000
Interest Rate
6.8%
Purchase Details
Closed on
Sep 8, 1987
Create a Home Valuation Report for This Property
The Home Valuation Report is an in-depth analysis detailing your home's value as well as a comparison with similar homes in the area
Home Values in the Area
Average Home Value in this Area
Purchase History
| Date | Buyer | Sale Price | Title Company |
|---|---|---|---|
| Eck Victoria Boyer | -- | None Available | |
| Eck Living Trust | -- | None Available | |
| Eck Victoria Boyer | -- | None Available | |
| Boyer Gregory Vaitl | -- | None Available | |
| Boyer Alice | -- | -- | |
| Boyer Alice | -- | South Coast Title Co | |
| -- | $275,000 | -- |
Source: Public Records
Mortgage History
| Date | Status | Borrower | Loan Amount |
|---|---|---|---|
| Previous Owner | Boyer Alice | $120,000 |
Source: Public Records
Tax History Compared to Growth
Tax History
| Year | Tax Paid | Tax Assessment Tax Assessment Total Assessment is a certain percentage of the fair market value that is determined by local assessors to be the total taxable value of land and additions on the property. | Land | Improvement |
|---|---|---|---|---|
| 2025 | $9,495 | $896,499 | $561,216 | $335,283 |
| 2024 | $9,495 | $878,921 | $550,212 | $328,709 |
| 2023 | $9,286 | $861,688 | $539,424 | $322,264 |
| 2022 | $9,134 | $844,794 | $528,848 | $315,946 |
| 2021 | $8,975 | $828,230 | $518,479 | $309,751 |
| 2020 | $8,897 | $819,738 | $513,163 | $306,575 |
| 2019 | $8,727 | $803,665 | $503,101 | $300,564 |
| 2018 | $8,562 | $787,908 | $493,237 | $294,671 |
| 2017 | $82 | $772,460 | $483,566 | $288,894 |
| 2016 | $4,688 | $444,630 | $98,170 | $346,460 |
| 2015 | $4,619 | $437,952 | $96,696 | $341,256 |
| 2014 | $4,526 | $429,374 | $94,802 | $334,572 |
Source: Public Records
Map
Nearby Homes
- 13074 Maritime Place Unit 1
- 13398 Tiverton Rd
- 2490 Pinewood St
- 3539 Voyager Cir Unit 15
- 3510 Voyager Cir Unit 67
- 13596 Jadestone Way
- 3856 Quarter Mile Dr
- 13323 Kibbings Rd
- 13632 Derby Downs Ct
- 13404 Kibbings Rd
- 2582 Del Mar Heights Rd Unit 17
- 13732 Rosecroft Way
- 13735 Mango Dr Unit 212
- 13754 Mango Dr Unit 316
- 13754 Mango Dr Unit 111
- 722 Amphitheatre Dr
- 13774 Recuerdo Dr
- 3877 Pell Place Unit 108
- 12936 Carmel Creek Rd Unit 63
- 3550 Caminito el Rincon Unit 69
- 13262 Ocean Vista Rd
- 13270 Ocean Vista Rd
- 13274 Ocean Vista Rd
- 13258 Ocean Vista Rd
- 13278 Ocean Vista Rd
- 13252 Ocean Vista Rd
- 13282 Ocean Vista Rd
- 13254 Jacarte Ct
- 13248 Jacarte Ct
- 13260 Jacarte Ct
- 13242 Jacarte Ct
- 13266 Jacarte Ct
- 13286 Ocean Vista Rd
- 13236 Jacarte Ct
- 13274 Jacarte Ct Unit 4
- 13240 Ocean Vista Rd
- 13290 Ocean Vista Rd
- 13230 Jacarte Ct
- 13236 Ocean Vista Rd
- 13224 Jacarte Ct