Estimated Value: $797,000 - $899,000
3
Beds
2
Baths
1,794
Sq Ft
$479/Sq Ft
Est. Value
About This Home
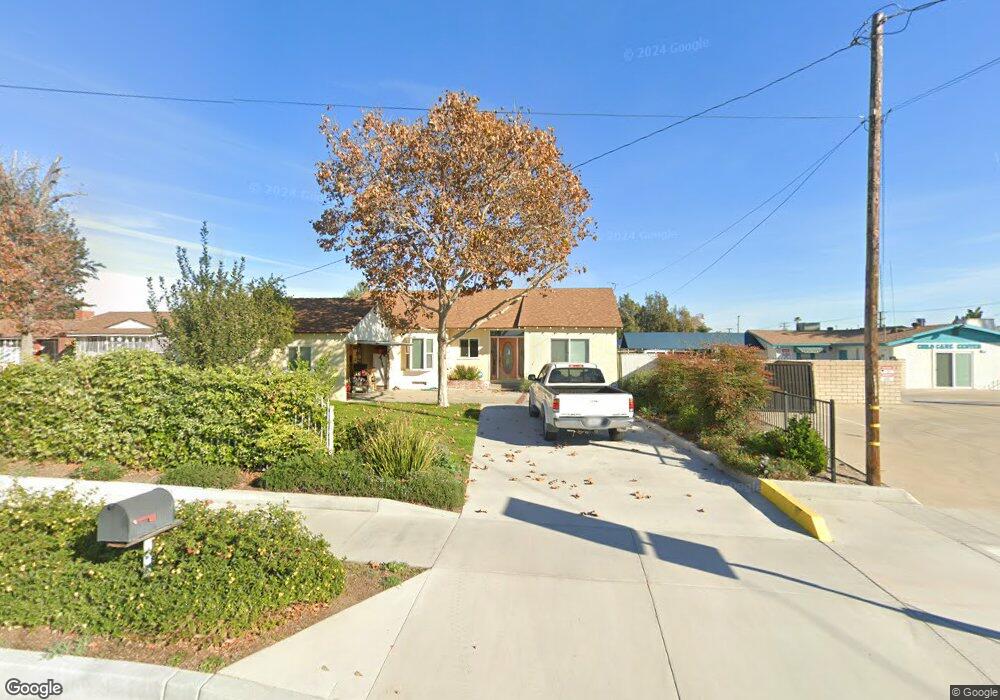
This home is located at 13267 Pipeline Ave, Chino, CA 91710 and is currently estimated at $858,864, approximately $478 per square foot. 13267 Pipeline Ave is a home located in San Bernardino County with nearby schools including Dickson Elementary, Ramona Junior High School, and Don Antonio Lugo High School.
Ownership History
Date
Name
Owned For
Owner Type
Purchase Details
Closed on
Aug 28, 2006
Sold by
Paine Gerald
Bought by
Paine Gerald and Paine Michelle
Current Estimated Value
Purchase Details
Closed on
Feb 11, 2001
Sold by
Kotama Rachanok
Bought by
Paine Gerald and Paine Michelle
Home Financials for this Owner
Home Financials are based on the most recent Mortgage that was taken out on this home.
Original Mortgage
$213,750
Interest Rate
7.06%
Purchase Details
Closed on
Jan 3, 2001
Sold by
Morales Kotama Rafaela
Bought by
Kotama Rachanok and Kotama Thanom
Home Financials for this Owner
Home Financials are based on the most recent Mortgage that was taken out on this home.
Original Mortgage
$213,750
Interest Rate
7.06%
Purchase Details
Closed on
Mar 10, 2000
Sold by
Gordon Joyce F
Bought by
Kotama Rachanok and Morales Kotama Rafaela
Home Financials for this Owner
Home Financials are based on the most recent Mortgage that was taken out on this home.
Original Mortgage
$171,000
Interest Rate
8.21%
Create a Home Valuation Report for This Property
The Home Valuation Report is an in-depth analysis detailing your home's value as well as a comparison with similar homes in the area
Home Values in the Area
Average Home Value in this Area
Purchase History
| Date | Buyer | Sale Price | Title Company |
|---|---|---|---|
| Paine Gerald | -- | None Available | |
| Paine Gerald | $225,000 | American Title Co | |
| Kotama Rachanok | -- | -- | |
| Kotama Rachanok | $180,000 | Fidelity National Title Ins |
Source: Public Records
Mortgage History
| Date | Status | Borrower | Loan Amount |
|---|---|---|---|
| Previous Owner | Paine Gerald | $213,750 | |
| Previous Owner | Kotama Rachanok | $171,000 |
Source: Public Records
Tax History Compared to Growth
Tax History
| Year | Tax Paid | Tax Assessment Tax Assessment Total Assessment is a certain percentage of the fair market value that is determined by local assessors to be the total taxable value of land and additions on the property. | Land | Improvement |
|---|---|---|---|---|
| 2025 | $3,613 | $339,045 | $118,667 | $220,378 |
| 2024 | $3,613 | $332,397 | $116,340 | $216,057 |
| 2023 | $3,512 | $325,880 | $114,059 | $211,821 |
| 2022 | $3,490 | $319,491 | $111,823 | $207,668 |
| 2021 | $3,420 | $313,226 | $109,630 | $203,596 |
| 2020 | $3,375 | $310,014 | $108,506 | $201,508 |
| 2019 | $3,315 | $303,935 | $106,378 | $197,557 |
| 2018 | $3,241 | $297,975 | $104,292 | $193,683 |
| 2017 | $3,187 | $292,132 | $102,247 | $189,885 |
| 2016 | $2,977 | $286,404 | $100,242 | $186,162 |
| 2015 | $2,990 | $282,102 | $98,736 | $183,366 |
| 2014 | $2,926 | $276,576 | $96,802 | $179,774 |
Source: Public Records
Map
Nearby Homes
- 13232 Yorkers Place Unit C
- 4449 Carmen St
- 13401 Wisteria Place
- 12958 Boston Ave
- 13640 Norton Ave
- 4524 Carmen St
- 13139 Derby Ave
- 4539 Carmen St
- 3947 Jose Ct
- 4621 Chino Ave
- 3778 Pilgrims Way
- 0 Pilgrims Way
- 3516 Larkwood Dr
- 13798 Roswell Ave
- 3557 Riverside Dr
- 4814 Ranch Rd
- 4099 Walnut Ave
- 12951 Royal Palm Cir
- 4912 G St
- 13115 Monte Vista Ave
- 13255 Pipeline Ave
- 4124 Chino Ave
- 13241 Pipeline Ave
- 13229 Pipeline Ave
- 13244 Pipeline Ave
- 4076 Chino Ave
- 13312 San Martin Place
- 4160 Chino Ave
- 13219 Pipeline Ave
- 13311 San Martin Place
- 13324 San Martin Place
- 13218 Pipeline Ave
- 13203 Pipeline Ave
- 13314 San Pedro Place
- 13323 San Martin Place
- 13336 San Martin Place
- 4162 Chino Ave
- 13326 San Pedro Place
- 13335 San Martin Place
- 13348 San Martin Place