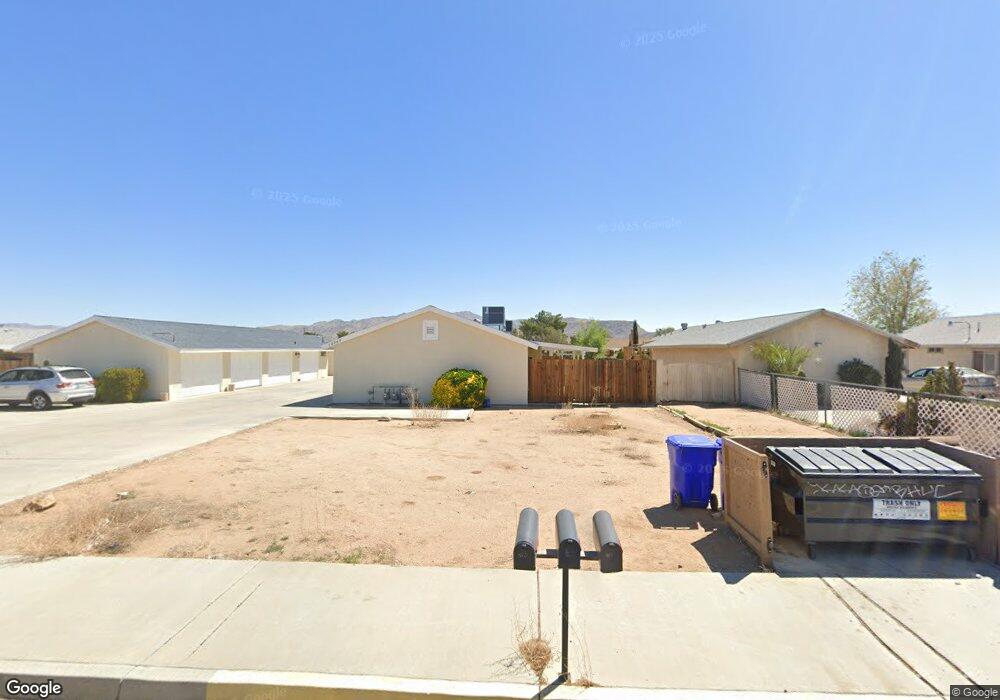
13269 Central Rd Unit 3 Apple Valley, CA 92308
High Desert NeighborhoodEstimated Value: $458,000 - $641,000
2
Beds
2
Baths
3,159
Sq Ft
$183/Sq Ft
Est. Value
About This Home
This home is located at 13269 Central Rd Unit 3, Apple Valley, CA 92308 and is currently estimated at $578,532, approximately $183 per square foot. 13269 Central Rd Unit 3 is a home located in San Bernardino County with nearby schools including Rancho Verde Elementary School and Granite Hills High School.
Ownership History
Date
Name
Owned For
Owner Type
Purchase Details
Closed on
Feb 8, 2024
Sold by
Huey Chong En
Bought by
Derich Capital Llc
Current Estimated Value
Purchase Details
Closed on
Aug 7, 2023
Sold by
Lee Yi
Bought by
Chong En
Home Financials for this Owner
Home Financials are based on the most recent Mortgage that was taken out on this home.
Original Mortgage
$431,250
Interest Rate
6.71%
Mortgage Type
New Conventional
Purchase Details
Closed on
Jul 21, 2023
Sold by
Haig Josiah J and Haig Trea L
Bought by
Chong En
Home Financials for this Owner
Home Financials are based on the most recent Mortgage that was taken out on this home.
Original Mortgage
$431,250
Interest Rate
6.71%
Mortgage Type
New Conventional
Purchase Details
Closed on
Aug 18, 2010
Sold by
Packowski John E
Bought by
Haig Josiah D and Haig Trea L
Home Financials for this Owner
Home Financials are based on the most recent Mortgage that was taken out on this home.
Original Mortgage
$142,000
Interest Rate
4.16%
Mortgage Type
VA
Create a Home Valuation Report for This Property
The Home Valuation Report is an in-depth analysis detailing your home's value as well as a comparison with similar homes in the area
Home Values in the Area
Average Home Value in this Area
Purchase History
| Date | Buyer | Sale Price | Title Company |
|---|---|---|---|
| Derich Capital Llc | -- | None Listed On Document | |
| Chong En | -- | Usa National Title | |
| Chong En | $575,000 | Usa National Title | |
| Haig Josiah D | $142,000 | First American Title Company |
Source: Public Records
Mortgage History
| Date | Status | Borrower | Loan Amount |
|---|---|---|---|
| Previous Owner | Chong En | $431,250 | |
| Previous Owner | Haig Josiah D | $142,000 |
Source: Public Records
Tax History
| Year | Tax Paid | Tax Assessment Tax Assessment Total Assessment is a certain percentage of the fair market value that is determined by local assessors to be the total taxable value of land and additions on the property. | Land | Improvement |
|---|---|---|---|---|
| 2025 | $7,003 | $586,500 | $86,700 | $499,800 |
| 2024 | $6,806 | $575,000 | $85,000 | $490,000 |
| 2023 | $2,383 | $174,862 | $22,165 | $152,697 |
| 2022 | $2,346 | $171,433 | $21,730 | $149,703 |
| 2021 | $2,293 | $168,072 | $21,304 | $146,768 |
| 2020 | $1,156 | $166,349 | $21,086 | $145,263 |
| 2019 | $2,221 | $163,088 | $20,673 | $142,415 |
| 2018 | $2,168 | $159,891 | $20,268 | $139,623 |
| 2017 | $2,137 | $156,756 | $19,871 | $136,885 |
| 2016 | $1,927 | $153,682 | $19,481 | $134,201 |
| 2015 | $2,156 | $151,373 | $19,188 | $132,185 |
| 2014 | $1,872 | $148,408 | $18,812 | $129,596 |
Source: Public Records
Map
Nearby Homes
- 22449 Ottawa Rd
- 0 Pueblo Rd Unit PW26039460
- 13492 Central Rd
- 22725 Anoka Rd
- 0 Malaki Rd
- 1 Malaki Rd
- 39124 Malaki Rd
- 22517 Ojai Rd
- 22684 Powhatan Rd
- 0 Nomwaket Rd
- 13615 Pauhaska Rd
- 22325 Us Hwy 18 Unit 32
- 22325 California 18
- 13285 Mesquite Rd
- 13422 Nicola Rd
- 13493 Mesquite Rd
- 22241 Nisqually Rd Unit 118
- 22241 Nisqually Rd Unit 169
- 22241 Nisqually Rd Unit 143
- 22241 Nisqually Rd Unit 63
- 13269 Central Rd
- 13253 Central Rd
- 22501 Ottawa Rd
- 13270 Topock Rd
- 13254 Topock Rd
- 13239 Central Rd
- 13240 Topock Rd
- 13191 Central Rd
- 13224 Topock Rd
- 13271 Topock Rd
- 13207 Central Rd
- 13312 Pauhaska Rd
- 13287 Topock Rd
- 13208 Topock Rd
- 13241 Topock Rd
- 13322 Pauhaska Rd
- 13225 Topock Rd
- 13192 Topock Rd
- 13209 Topock Rd
Your Personal Tour Guide
Ask me questions while you tour the home.