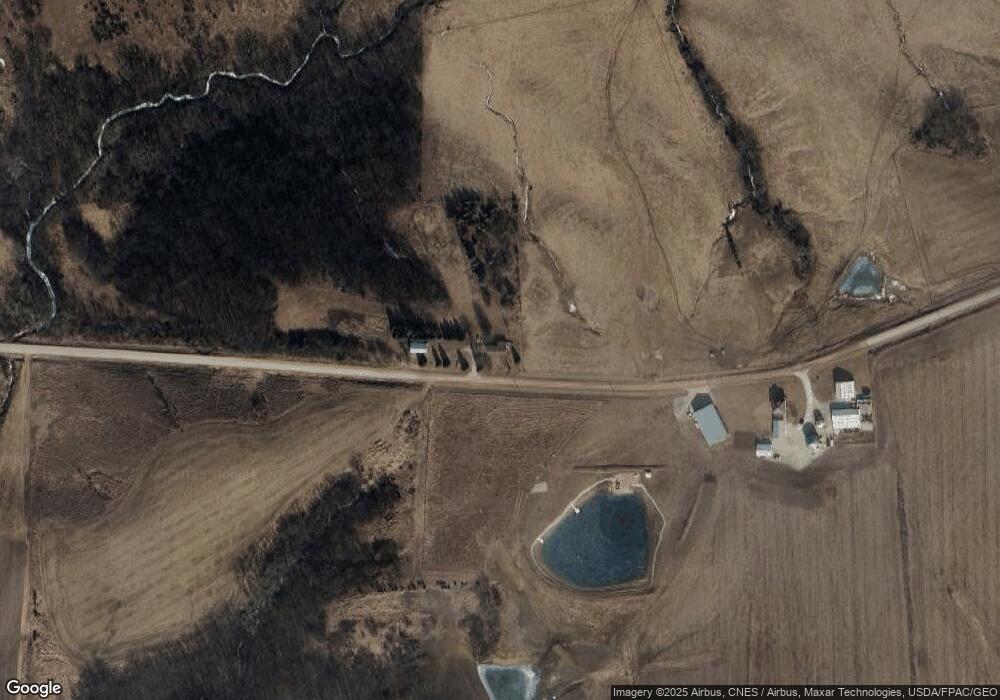
1327 510th Ave Montezuma, IA 50171
Estimated Value: $261,000 - $501,000
--
Bed
2
Baths
1,640
Sq Ft
$250/Sq Ft
Est. Value
About This Home
This home is located at 1327 510th Ave, Montezuma, IA 50171 and is currently estimated at $410,361, approximately $250 per square foot. 1327 510th Ave is a home located in Poweshiek County with nearby schools including Montezuma Elementary School and Montezuma Junior High School.
Ownership History
Date
Name
Owned For
Owner Type
Purchase Details
Closed on
May 25, 2005
Sold by
Smith Kenneth G and Smith Lesa
Bought by
Dawley Kelly P and Dawley Misti L
Current Estimated Value
Home Financials for this Owner
Home Financials are based on the most recent Mortgage that was taken out on this home.
Original Mortgage
$130,400
Outstanding Balance
$68,297
Interest Rate
5.91%
Mortgage Type
New Conventional
Estimated Equity
$342,064
Create a Home Valuation Report for This Property
The Home Valuation Report is an in-depth analysis detailing your home's value as well as a comparison with similar homes in the area
Home Values in the Area
Average Home Value in this Area
Purchase History
| Date | Buyer | Sale Price | Title Company |
|---|---|---|---|
| Dawley Kelly P | $163,000 | None Available |
Source: Public Records
Mortgage History
| Date | Status | Borrower | Loan Amount |
|---|---|---|---|
| Open | Dawley Kelly P | $130,400 |
Source: Public Records
Tax History Compared to Growth
Tax History
| Year | Tax Paid | Tax Assessment Tax Assessment Total Assessment is a certain percentage of the fair market value that is determined by local assessors to be the total taxable value of land and additions on the property. | Land | Improvement |
|---|---|---|---|---|
| 2025 | $2,152 | $278,650 | $82,130 | $196,520 |
| 2024 | $2,238 | $231,440 | $51,650 | $179,790 |
| 2023 | $2,222 | $231,440 | $51,650 | $179,790 |
| 2022 | $2,240 | $193,080 | $41,340 | $151,740 |
| 2021 | $2,240 | $182,150 | $39,000 | $143,150 |
| 2020 | $1,950 | $158,320 | $32,500 | $125,820 |
| 2019 | $1,620 | $158,320 | $32,500 | $125,820 |
| 2018 | $1,598 | $128,940 | $25,000 | $103,940 |
| 2017 | $1,600 | $128,940 | $25,000 | $103,940 |
| 2016 | $1,580 | $128,940 | $25,000 | $103,940 |
| 2015 | $1,580 | $128,940 | $25,000 | $103,940 |
| 2014 | $1,280 | $107,110 | $23,960 | $83,150 |
Source: Public Records
Map
Nearby Homes