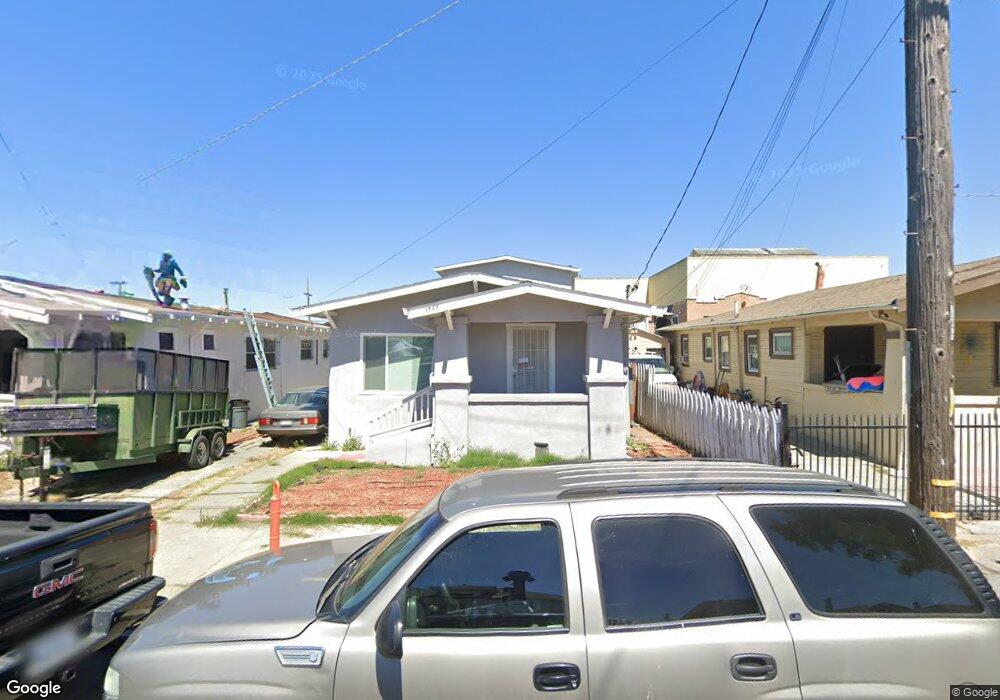
1327 93rd Ave Oakland, CA 94603
Elmhurst Park NeighborhoodEstimated Value: $479,000 - $799,000
3
Beds
3
Baths
1,800
Sq Ft
$383/Sq Ft
Est. Value
About This Home
This home is located at 1327 93rd Ave, Oakland, CA 94603 and is currently estimated at $689,854, approximately $383 per square foot. 1327 93rd Ave is a home located in Alameda County with nearby schools including New Highland Academy, Acorn Woodland Elementary School, and Encompass Academy Elementary.
Ownership History
Date
Name
Owned For
Owner Type
Purchase Details
Closed on
Sep 10, 2019
Sold by
Bay Area Executive Re And Development Gr
Bought by
Kimmons Katherine
Current Estimated Value
Home Financials for this Owner
Home Financials are based on the most recent Mortgage that was taken out on this home.
Original Mortgage
$648,045
Outstanding Balance
$568,797
Interest Rate
3.7%
Mortgage Type
FHA
Estimated Equity
$121,057
Purchase Details
Closed on
Feb 8, 2019
Sold by
Johnson Nelda Briggs
Bought by
Bay Area Executive Re & Development Grou
Home Financials for this Owner
Home Financials are based on the most recent Mortgage that was taken out on this home.
Original Mortgage
$314,500
Interest Rate
4.4%
Mortgage Type
Construction
Create a Home Valuation Report for This Property
The Home Valuation Report is an in-depth analysis detailing your home's value as well as a comparison with similar homes in the area
Home Values in the Area
Average Home Value in this Area
Purchase History
| Date | Buyer | Sale Price | Title Company |
|---|---|---|---|
| Kimmons Katherine | $660,000 | Chicago Title Company | |
| Bay Area Executive Re & Development Grou | $370,000 | Chicago Title Company |
Source: Public Records
Mortgage History
| Date | Status | Borrower | Loan Amount |
|---|---|---|---|
| Open | Kimmons Katherine | $648,045 | |
| Previous Owner | Bay Area Executive Re & Development Grou | $314,500 |
Source: Public Records
Tax History Compared to Growth
Tax History
| Year | Tax Paid | Tax Assessment Tax Assessment Total Assessment is a certain percentage of the fair market value that is determined by local assessors to be the total taxable value of land and additions on the property. | Land | Improvement |
|---|---|---|---|---|
| 2025 | $11,264 | $837,795 | $216,538 | $621,257 |
| 2024 | $11,264 | $707,644 | $212,293 | $495,351 |
| 2023 | $11,796 | $693,771 | $208,131 | $485,640 |
| 2022 | $11,423 | $680,168 | $204,050 | $476,118 |
| 2021 | $10,877 | $666,837 | $200,051 | $466,786 |
| 2020 | $10,756 | $660,000 | $198,000 | $462,000 |
| 2019 | $1,683 | $39,860 | $14,866 | $24,994 |
| 2018 | $4,227 | $39,079 | $14,575 | $24,504 |
| 2017 | $1,547 | $38,313 | $14,289 | $24,024 |
| 2016 | $1,393 | $37,562 | $14,009 | $23,553 |
| 2015 | $1,380 | $36,997 | $13,798 | $23,199 |
| 2014 | $1,266 | $36,273 | $13,528 | $22,745 |
Source: Public Records
Map
Nearby Homes