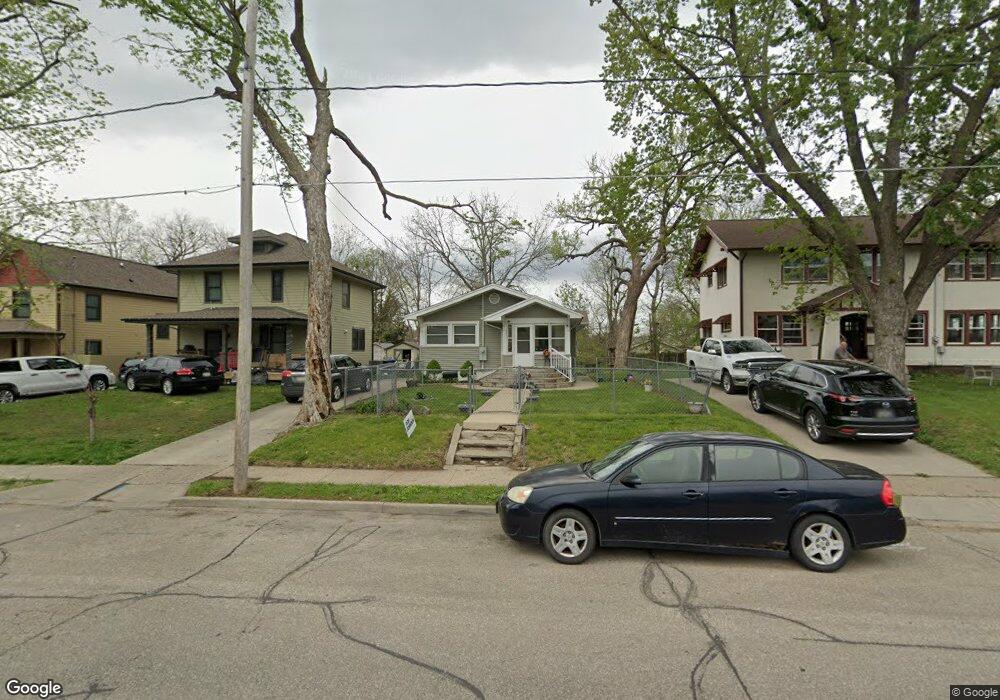
1327 Clark St Des Moines, IA 50314
Mondamin Presidential NeighborhoodEstimated Value: $121,000 - $185,000
3
Beds
1
Bath
1,106
Sq Ft
$130/Sq Ft
Est. Value
About This Home
This home is located at 1327 Clark St, Des Moines, IA 50314 and is currently estimated at $143,228, approximately $129 per square foot. 1327 Clark St is a home located in Polk County with nearby schools including King Elementary School, Meredith Middle School, and Hoover High School.
Ownership History
Date
Name
Owned For
Owner Type
Purchase Details
Closed on
Apr 5, 2007
Sold by
Kent Jason M and Kent Tammy
Bought by
Thomas Liddell and Thomas Laura Ardella
Current Estimated Value
Home Financials for this Owner
Home Financials are based on the most recent Mortgage that was taken out on this home.
Original Mortgage
$63,500
Outstanding Balance
$38,140
Interest Rate
6.12%
Mortgage Type
Purchase Money Mortgage
Estimated Equity
$105,088
Purchase Details
Closed on
Apr 4, 2007
Sold by
Hearn Daniel C
Bought by
Kent Jason M
Home Financials for this Owner
Home Financials are based on the most recent Mortgage that was taken out on this home.
Original Mortgage
$63,500
Outstanding Balance
$38,140
Interest Rate
6.12%
Mortgage Type
Purchase Money Mortgage
Estimated Equity
$105,088
Purchase Details
Closed on
Nov 22, 2005
Sold by
National City Bank
Bought by
Kent Jason M
Purchase Details
Closed on
Jan 14, 1998
Sold by
Hearn Daniel C
Bought by
Prentice Rollan Jay and Prentice Beverly
Create a Home Valuation Report for This Property
The Home Valuation Report is an in-depth analysis detailing your home's value as well as a comparison with similar homes in the area
Home Values in the Area
Average Home Value in this Area
Purchase History
| Date | Buyer | Sale Price | Title Company |
|---|---|---|---|
| Thomas Liddell | $63,000 | Itc | |
| Kent Jason M | -- | Itc | |
| Kent Jason M | $23,000 | Title Services Corporation | |
| Prentice Rollan Jay | $30,000 | -- |
Source: Public Records
Mortgage History
| Date | Status | Borrower | Loan Amount |
|---|---|---|---|
| Open | Thomas Liddell | $63,500 |
Source: Public Records
Tax History Compared to Growth
Tax History
| Year | Tax Paid | Tax Assessment Tax Assessment Total Assessment is a certain percentage of the fair market value that is determined by local assessors to be the total taxable value of land and additions on the property. | Land | Improvement |
|---|---|---|---|---|
| 2025 | $1,802 | $105,100 | $15,000 | $90,100 |
| 2024 | $1,802 | $91,600 | $12,900 | $78,700 |
| 2023 | $1,598 | $91,600 | $12,900 | $78,700 |
| 2022 | $1,586 | $67,800 | $9,800 | $58,000 |
| 2021 | $982 | $67,800 | $9,800 | $58,000 |
| 2020 | $1,020 | $60,800 | $8,700 | $52,100 |
| 2019 | $1,034 | $60,800 | $8,700 | $52,100 |
| 2018 | $1,024 | $55,500 | $7,800 | $47,700 |
| 2017 | $1,038 | $55,500 | $7,800 | $47,700 |
| 2016 | $1,012 | $56,600 | $7,700 | $48,900 |
| 2015 | $1,012 | $56,600 | $7,700 | $48,900 |
| 2014 | $978 | $50,300 | $7,500 | $42,800 |
Source: Public Records
Map
Nearby Homes