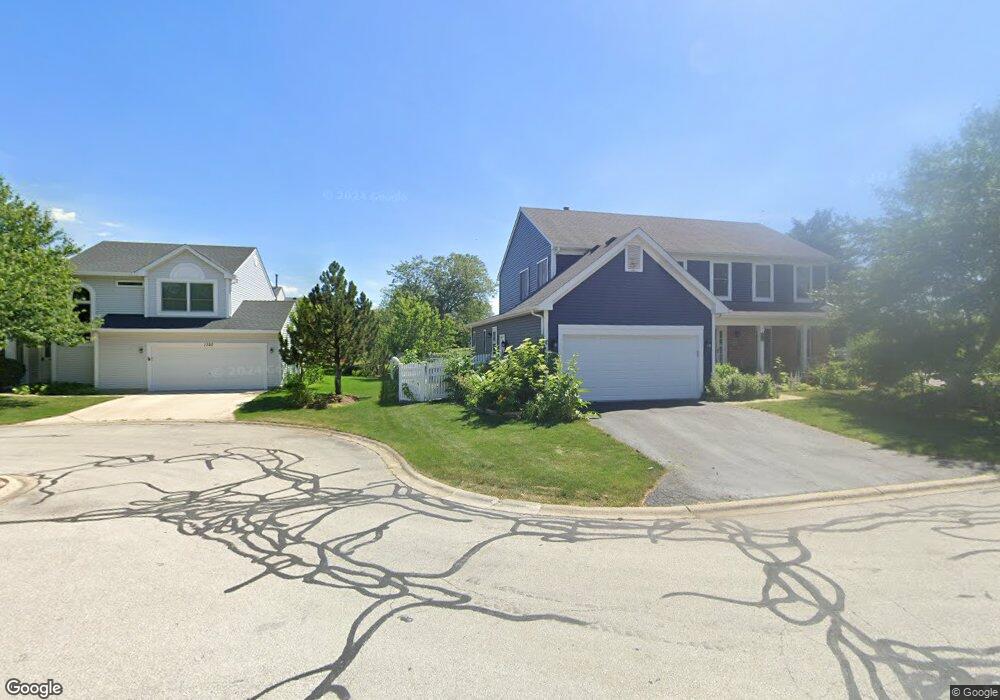
1327 Lazy Hollow Ct Naperville, IL 60565
Greene Valley NeighborhoodEstimated Value: $509,000 - $557,000
--
Bed
1
Bath
2,105
Sq Ft
$256/Sq Ft
Est. Value
About This Home
This home is located at 1327 Lazy Hollow Ct, Naperville, IL 60565 and is currently estimated at $539,846, approximately $256 per square foot. 1327 Lazy Hollow Ct is a home located in DuPage County with nearby schools including Ranch View Elementary School, Kennedy Junior High School, and Naperville Central High School.
Ownership History
Date
Name
Owned For
Owner Type
Purchase Details
Closed on
Jun 26, 2025
Sold by
Rodriguez Frankin
Bought by
Rodriguez Maria F
Current Estimated Value
Purchase Details
Closed on
Mar 16, 2004
Sold by
Jacome Cesar P
Bought by
Rodriguez Maria
Purchase Details
Closed on
Jan 17, 2004
Sold by
Rodriguez Maria
Bought by
Jacome Cesar P
Purchase Details
Closed on
Aug 28, 2003
Sold by
Wei Datong and Peng Wei
Bought by
Rodriguez Franklin and Rodriguez Maria
Home Financials for this Owner
Home Financials are based on the most recent Mortgage that was taken out on this home.
Original Mortgage
$291,000
Interest Rate
8.7%
Mortgage Type
Purchase Money Mortgage
Purchase Details
Closed on
Apr 23, 1997
Sold by
Bernardi Dawson Mark A and Bernardi Dawson M Catherine
Bought by
Wei Datong and Peng Wei
Home Financials for this Owner
Home Financials are based on the most recent Mortgage that was taken out on this home.
Original Mortgage
$160,000
Interest Rate
6.5%
Create a Home Valuation Report for This Property
The Home Valuation Report is an in-depth analysis detailing your home's value as well as a comparison with similar homes in the area
Home Values in the Area
Average Home Value in this Area
Purchase History
| Date | Buyer | Sale Price | Title Company |
|---|---|---|---|
| Rodriguez Maria F | -- | None Listed On Document | |
| Rodriguez Maria | -- | Multiple | |
| Jacome Cesar P | -- | Multiple | |
| Rodriguez Franklin | $281,000 | Multiple | |
| Wei Datong | $201,000 | -- |
Source: Public Records
Mortgage History
| Date | Status | Borrower | Loan Amount |
|---|---|---|---|
| Previous Owner | Rodriguez Franklin | $291,000 | |
| Previous Owner | Wei Datong | $160,000 |
Source: Public Records
Tax History Compared to Growth
Tax History
| Year | Tax Paid | Tax Assessment Tax Assessment Total Assessment is a certain percentage of the fair market value that is determined by local assessors to be the total taxable value of land and additions on the property. | Land | Improvement |
|---|---|---|---|---|
| 2024 | $9,032 | $155,436 | $52,407 | $103,029 |
| 2023 | $8,698 | $141,860 | $47,830 | $94,030 |
| 2022 | $7,958 | $128,960 | $43,480 | $85,480 |
| 2021 | $7,665 | $124,090 | $41,840 | $82,250 |
| 2020 | $7,501 | $121,860 | $41,090 | $80,770 |
| 2019 | $7,279 | $116,590 | $39,310 | $77,280 |
| 2018 | $7,281 | $116,590 | $39,310 | $77,280 |
| 2017 | $7,132 | $112,650 | $37,980 | $74,670 |
| 2016 | $6,987 | $108,580 | $36,610 | $71,970 |
| 2015 | $6,938 | $102,250 | $34,480 | $67,770 |
| 2014 | $6,802 | $97,380 | $32,840 | $64,540 |
| 2013 | $6,699 | $97,610 | $32,920 | $64,690 |
Source: Public Records
Map
Nearby Homes
- 1817 Appaloosa Dr
- 23W731 Hobson Rd
- 1519 77th St
- 7S610 Lynn Dr
- 1704 Kenyon Dr
- 1501 Clarkson Ct
- 1216 Tranquility Ct
- 6812 Greene Rd
- 1323 Auburn Ave
- 1340 Auburn Ave
- 6551 Shagbark Ct Unit 2
- 1006 Bankfield Ct
- 6441 Bobby Jones Ln Unit 2
- 3207 Foxridge Ct
- 2651 Yorkshire Ln
- 6420 Double Eagle Dr Unit 510
- 6420 Double Eagle Dr Unit E35
- 6420 Double Eagle Dr Unit 610
- 6420 Double Eagle Dr Unit 712
- 6420 Double Eagle Dr Unit 403
- 1323 Lazy Hollow Ct
- 1324 Lazy Hollow Ct
- 1319 Lazy Hollow Ct
- 1315 Lazy Hollow Ct
- 1316 Lazy Hollow Ct
- 2055 Pleasant Run Ct
- 2051 Pleasant Run Ct
- 1311 Lazy Hollow Ct
- 1303 Lazy Hollow Ct
- 2056 Pleasant Run Ct
- 2052 Pleasant Run Ct
- 1307 Lazy Hollow Ct
- 2012 Cobblebrook Ln
- 2016 Cobblebrook Ln
- 2051 Thistle Hill Ct
- 2055 Thistle Hill Ct
- 1308 Little Berry Ct
- 1304 Little Berry Ct
- 1996 Nutmeg Ln
- 2020 Cobblebrook Ln