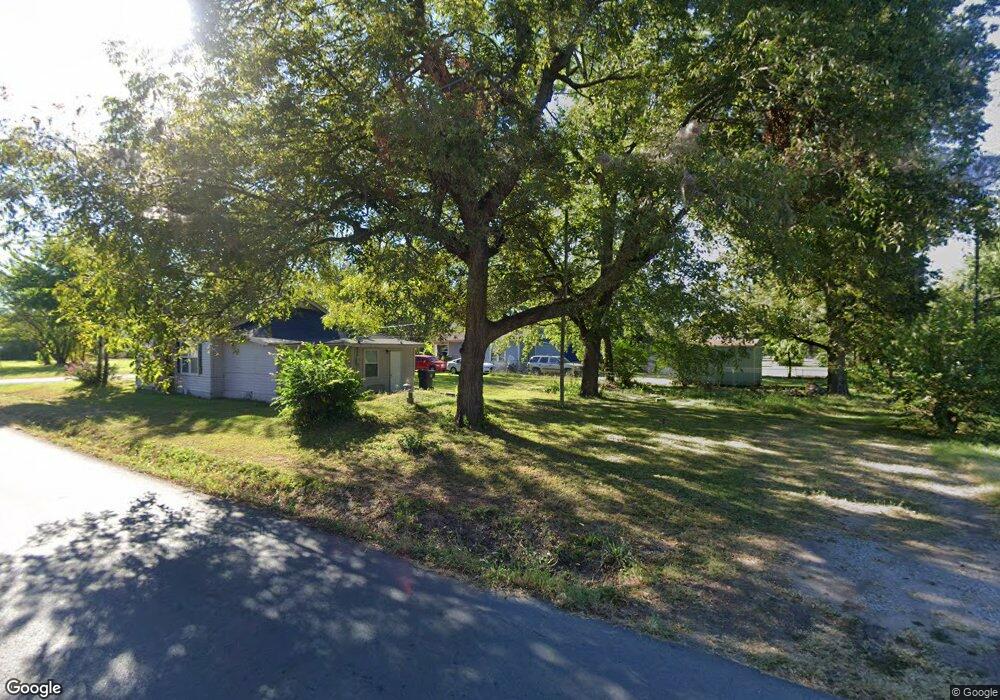
1327 Maple St Muskogee, OK 74403
Central Muskogee NeighborhoodEstimated Value: $39,000 - $102,000
2
Beds
1
Bath
936
Sq Ft
$81/Sq Ft
Est. Value
About This Home
This home is located at 1327 Maple St, Muskogee, OK 74403 and is currently estimated at $75,722, approximately $80 per square foot. 1327 Maple St is a home located in Muskogee County with nearby schools including Irving Elementary School, 8th & 9th Grade Academy @ Alice Robertson, and Muskogee High School.
Ownership History
Date
Name
Owned For
Owner Type
Purchase Details
Closed on
Jul 7, 2025
Sold by
Pitterman Dale G and Chrystal Louise
Bought by
Pitterman Dale G and Pitterman Chrystal Louise
Current Estimated Value
Purchase Details
Closed on
May 31, 2024
Sold by
Pitterman Mark
Bought by
Pitterman Dale G
Home Financials for this Owner
Home Financials are based on the most recent Mortgage that was taken out on this home.
Original Mortgage
$44,000
Interest Rate
6.38%
Mortgage Type
New Conventional
Purchase Details
Closed on
May 22, 2007
Sold by
Carolan Terry D and Carolan Clera
Bought by
Pitterman Mark
Home Financials for this Owner
Home Financials are based on the most recent Mortgage that was taken out on this home.
Original Mortgage
$40,366
Interest Rate
6.16%
Mortgage Type
FHA
Purchase Details
Closed on
Aug 1, 2006
Sold by
Hapmton Sharon A and Washington Stanley
Bought by
Carolan Terry D and Carolan Ciera
Purchase Details
Closed on
Mar 6, 2002
Create a Home Valuation Report for This Property
The Home Valuation Report is an in-depth analysis detailing your home's value as well as a comparison with similar homes in the area
Home Values in the Area
Average Home Value in this Area
Purchase History
| Date | Buyer | Sale Price | Title Company |
|---|---|---|---|
| Pitterman Dale G | -- | None Listed On Document | |
| Pitterman Dale G | -- | Nations Title Agency | |
| Pitterman Mark | $41,500 | None Available | |
| Carolan Terry D | $24,000 | None Available | |
| -- | -- | -- |
Source: Public Records
Mortgage History
| Date | Status | Borrower | Loan Amount |
|---|---|---|---|
| Previous Owner | Pitterman Dale G | $44,000 | |
| Previous Owner | Pitterman Mark | $40,366 |
Source: Public Records
Tax History
| Year | Tax Paid | Tax Assessment Tax Assessment Total Assessment is a certain percentage of the fair market value that is determined by local assessors to be the total taxable value of land and additions on the property. | Land | Improvement |
|---|---|---|---|---|
| 2025 | $540 | $4,820 | $504 | $4,316 |
| 2024 | $391 | $4,591 | $480 | $4,111 |
| 2023 | $391 | $4,590 | $460 | $4,130 |
| 2022 | $332 | $4,456 | $453 | $4,003 |
| 2021 | $320 | $4,201 | $440 | $3,761 |
| 2020 | $321 | $4,201 | $440 | $3,761 |
| 2019 | $318 | $4,201 | $440 | $3,761 |
| 2018 | $312 | $4,201 | $440 | $3,761 |
| 2017 | $302 | $4,201 | $440 | $3,761 |
| 2016 | $319 | $4,351 | $440 | $3,911 |
| 2015 | $316 | $4,351 | $440 | $3,911 |
| 2014 | $322 | $4,351 | $440 | $3,911 |
Source: Public Records
Map
Nearby Homes
Your Personal Tour Guide
Ask me questions while you tour the home.