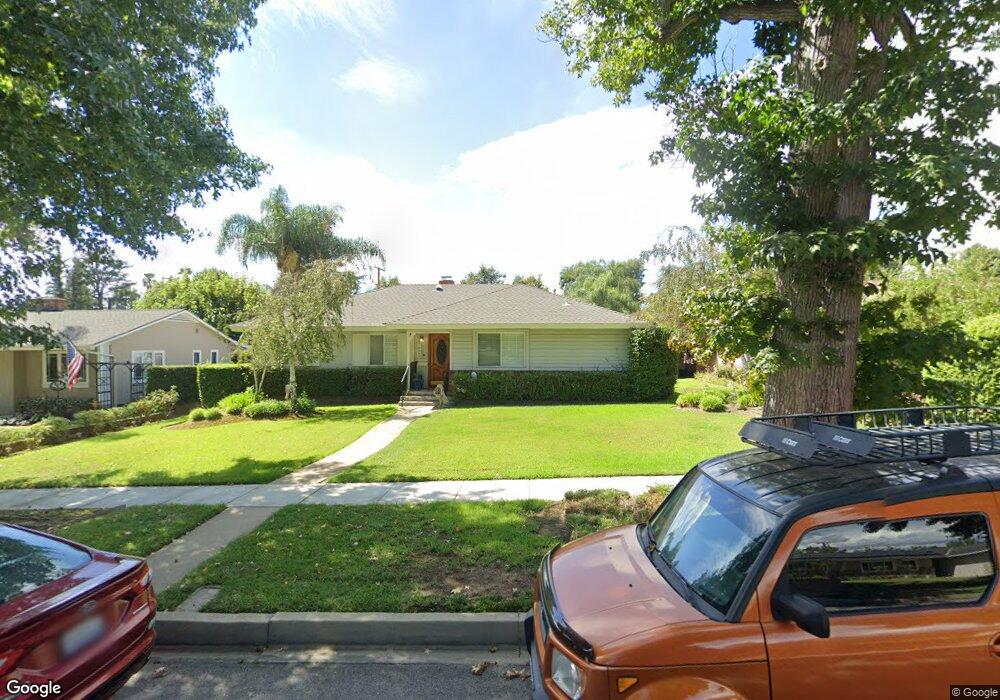
1327 N 1st Ave Upland, CA 91786
Estimated Value: $718,000 - $853,000
3
Beds
2
Baths
1,426
Sq Ft
$546/Sq Ft
Est. Value
About This Home
This home is located at 1327 N 1st Ave, Upland, CA 91786 and is currently estimated at $778,382, approximately $545 per square foot. 1327 N 1st Ave is a home located in San Bernardino County with nearby schools including Sierra Vista Elementary School, Upland Junior High School, and Upland High School.
Ownership History
Date
Name
Owned For
Owner Type
Purchase Details
Closed on
Feb 7, 2023
Sold by
Alvarez Jose Luis
Bought by
Alvarez Anna Myrea
Current Estimated Value
Home Financials for this Owner
Home Financials are based on the most recent Mortgage that was taken out on this home.
Original Mortgage
$200,000
Outstanding Balance
$193,448
Interest Rate
6.09%
Mortgage Type
New Conventional
Estimated Equity
$584,934
Purchase Details
Closed on
Jan 19, 2023
Sold by
Carnes Family Trust and Alvarez Anna Myrea
Bought by
Alvarez Kathleen Louise and Alvarez Anna Myrea
Home Financials for this Owner
Home Financials are based on the most recent Mortgage that was taken out on this home.
Original Mortgage
$200,000
Outstanding Balance
$193,448
Interest Rate
6.09%
Mortgage Type
New Conventional
Estimated Equity
$584,934
Purchase Details
Closed on
Oct 24, 2003
Sold by
Carnes Shirley Dora and Carnes Shirley
Bought by
Carnes Shirley Dora and The Carnes Family Trust
Create a Home Valuation Report for This Property
The Home Valuation Report is an in-depth analysis detailing your home's value as well as a comparison with similar homes in the area
Home Values in the Area
Average Home Value in this Area
Purchase History
| Date | Buyer | Sale Price | Title Company |
|---|---|---|---|
| Alvarez Anna Myrea | -- | Fidelity National Title Compan | |
| Alvarez Kathleen Louise | -- | Fidelity National Title Compan | |
| Alvarez Kathleen Louise | -- | Fidelity National Title Compan | |
| Carnes Shirley Dora | -- | -- |
Source: Public Records
Mortgage History
| Date | Status | Borrower | Loan Amount |
|---|---|---|---|
| Open | Alvarez Anna Myrea | $200,000 | |
| Closed | Alvarez Kathleen Louise | $200,000 |
Source: Public Records
Tax History
| Year | Tax Paid | Tax Assessment Tax Assessment Total Assessment is a certain percentage of the fair market value that is determined by local assessors to be the total taxable value of land and additions on the property. | Land | Improvement |
|---|---|---|---|---|
| 2025 | $3,294 | $294,759 | $101,943 | $192,816 |
| 2024 | $3,189 | $288,979 | $99,944 | $189,035 |
| 2023 | $3,138 | $283,312 | $97,984 | $185,328 |
| 2022 | $3,011 | $272,366 | $94,175 | $178,191 |
| 2021 | $3,004 | $267,025 | $92,328 | $174,697 |
| 2020 | $2,922 | $264,287 | $91,381 | $172,906 |
| 2019 | $2,911 | $259,105 | $89,589 | $169,516 |
| 2018 | $2,841 | $254,024 | $87,832 | $166,192 |
| 2017 | $2,758 | $249,043 | $86,110 | $162,933 |
| 2016 | $2,565 | $244,160 | $84,422 | $159,738 |
| 2015 | $2,505 | $240,493 | $83,154 | $157,339 |
| 2014 | $2,440 | $235,782 | $81,525 | $154,257 |
Source: Public Records
Map
Nearby Homes
- 1270 N Euclid Ave
- 1318 N Laurel Ave
- 1234 N Laurel Ave
- 171 E 14th St
- 1418 Winston Ct
- 1403 N Tulare Way
- 922 N 4th Ave
- 910 N Redding Way Unit I
- 910 N Redding Way Unit F
- 655 Doreen Ct
- 855 N Palm Ave
- 769 Valadez St
- 929 E Foothill Blvd Unit 91
- 929 E Foothill Blvd Unit 15
- 929 E Foothill Blvd Unit 161
- 929 E Foothill Blvd
- 929 E Foothill Blvd Unit 53
- 636 N Palm Ave
- 1629 N Palm Ave
- 762 N Vallejo Way
- 1335 N 1st Ave
- 1321 N 1st Ave
- 1341 N 1st Ave
- 1317 N 1st Ave
- 1328 N Euclid Ave
- 1334 N Euclid Ave
- 1320 N Euclid Ave
- 1328 N 1st Ave
- 1322 N 1st Ave
- 1334 N 1st Ave
- 1340 N Euclid Ave
- 1347 N 1st Ave
- 1311 N 1st Ave
- 1314 N Euclid Ave
- 1314 N 1st Ave
- 1340 N 1st Ave
- 1346 N Euclid Ave
- 1346 N 1st Ave
- 1310 N 1st Ave
- 1353 N 1st Ave
Your Personal Tour Guide
Ask me questions while you tour the home.