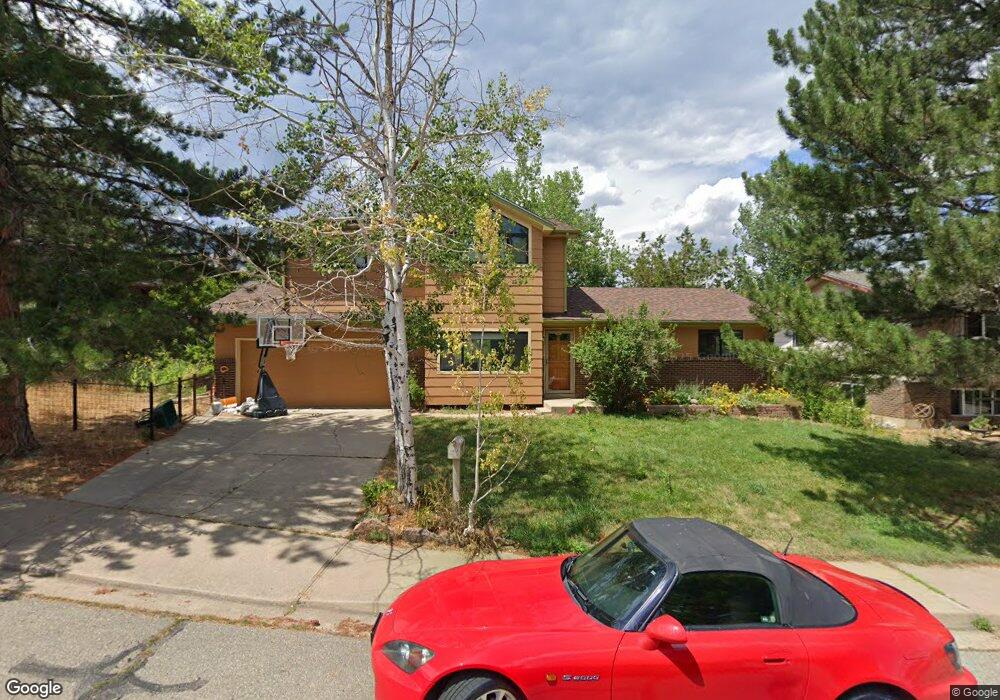
1327 Scrub Oak Cir Boulder, CO 80305
Table Mesa NeighborhoodEstimated Value: $1,300,027 - $1,535,000
5
Beds
2
Baths
1,804
Sq Ft
$781/Sq Ft
Est. Value
About This Home
This home is located at 1327 Scrub Oak Cir, Boulder, CO 80305 and is currently estimated at $1,409,507, approximately $781 per square foot. 1327 Scrub Oak Cir is a home located in Boulder County with nearby schools including Bear Creek Elementary School, Southern Hills Middle School, and Fairview High School.
Ownership History
Date
Name
Owned For
Owner Type
Purchase Details
Closed on
Nov 29, 2011
Sold by
Macarthur Deborah L
Bought by
Zirger Art J
Current Estimated Value
Home Financials for this Owner
Home Financials are based on the most recent Mortgage that was taken out on this home.
Original Mortgage
$417,000
Outstanding Balance
$285,530
Interest Rate
4.03%
Mortgage Type
New Conventional
Estimated Equity
$1,123,977
Purchase Details
Closed on
Oct 7, 2008
Sold by
Macarthur John D
Bought by
Macarthur Deborah L
Home Financials for this Owner
Home Financials are based on the most recent Mortgage that was taken out on this home.
Original Mortgage
$227,000
Interest Rate
5%
Mortgage Type
Purchase Money Mortgage
Purchase Details
Closed on
Sep 18, 1989
Bought by
Zirger Art J and Rowe Mary A
Purchase Details
Closed on
Dec 4, 1986
Bought by
Zirger Art J and Rowe Mary A
Purchase Details
Closed on
Oct 13, 1978
Bought by
Zirger Art J and Rowe Mary A
Purchase Details
Closed on
Sep 21, 1978
Bought by
Zirger Art J and Rowe Mary A
Create a Home Valuation Report for This Property
The Home Valuation Report is an in-depth analysis detailing your home's value as well as a comparison with similar homes in the area
Home Values in the Area
Average Home Value in this Area
Purchase History
| Date | Buyer | Sale Price | Title Company |
|---|---|---|---|
| Zirger Art J | $565,000 | Guardian Title | |
| Macarthur Deborah L | -- | None Available | |
| Zirger Art J | $88,500 | -- | |
| Zirger Art J | $84,000 | -- | |
| Zirger Art J | $53,500 | -- | |
| Zirger Art J | $49,500 | -- |
Source: Public Records
Mortgage History
| Date | Status | Borrower | Loan Amount |
|---|---|---|---|
| Open | Zirger Art J | $417,000 | |
| Previous Owner | Macarthur Deborah L | $227,000 |
Source: Public Records
Tax History
| Year | Tax Paid | Tax Assessment Tax Assessment Total Assessment is a certain percentage of the fair market value that is determined by local assessors to be the total taxable value of land and additions on the property. | Land | Improvement |
|---|---|---|---|---|
| 2025 | $7,760 | $82,100 | $55,275 | $26,825 |
| 2024 | $7,760 | $82,100 | $55,275 | $26,825 |
| 2023 | $7,625 | $88,293 | $63,436 | $28,542 |
| 2022 | $6,768 | $72,877 | $46,662 | $26,215 |
| 2021 | $6,453 | $74,975 | $48,005 | $26,970 |
| 2020 | $5,483 | $62,992 | $44,187 | $18,805 |
| 2019 | $5,399 | $62,992 | $44,187 | $18,805 |
| 2018 | $5,181 | $59,753 | $31,176 | $28,577 |
| 2017 | $5,018 | $66,060 | $34,467 | $31,593 |
| 2016 | $4,566 | $52,743 | $25,074 | $27,669 |
| 2015 | $4,323 | $45,746 | $20,696 | $25,050 |
| 2014 | $3,846 | $45,746 | $20,696 | $25,050 |
Source: Public Records
Map
Nearby Homes
- 1740 Bear Mountain Dr
- 2860 Table Mesa Dr
- 2610 Iliff St
- 3210 Emerson Ave
- 2665 Juilliard St
- 2596 Briarwood Dr
- 3450 Emerson Ave
- 3490 Emerson Ave
- 2235 Vassar Dr
- 2795 Vassar Dr
- 3394 Cripple Creek Trail Unit 15-H
- 3480 Cripple Creek Square
- 3391 Cripple Creek Trail Unit E
- 3281 Cripple Creek Trail Unit 10-A
- 2955 Stanford Ave
- 2585 Kohler Dr
- 1965 Kohler Dr
- 3755 Silver Plume Ln
- 3970 Longwood Ave
- 4380 Ludlow St
- 1333 Scrub Oak Cir
- 1323 Scrub Oak Cir
- 1278 Bear Mountain Ct
- 1276 Bear Mountain Ct
- 1337 Scrub Oak Cir
- 1313 Scrub Oak Cir
- 1326 Scrub Oak Cir
- 1332 Scrub Oak Cir
- 1328 Scrub Oak Cir
- 1334 Scrub Oak Cir
- 1336 Scrub Oak Cir
- 1282 Bear Mountain Ct
- 1272 Bear Mountain Ct
- 1304 Scrub Oak Cir
- 1343 Scrub Oak Cir
- 1303 Scrub Oak Cir
- 1324 Sandstone Ct
- 1338 Scrub Oak Cir
- 1302 Scrub Oak Cir
- 71 Benthaven Place
Your Personal Tour Guide
Ask me questions while you tour the home.