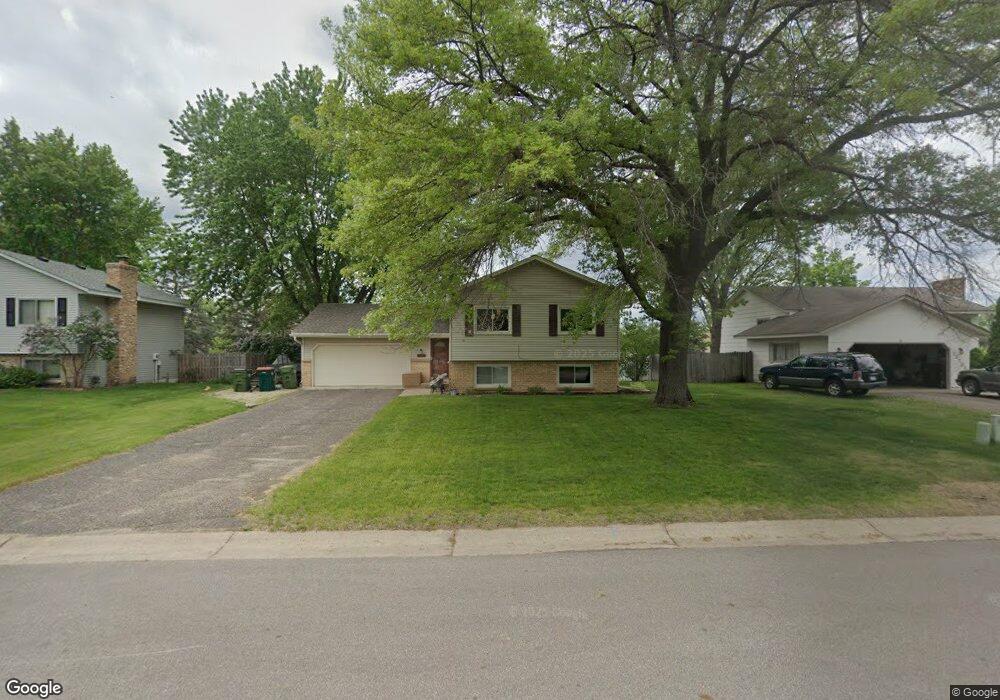
13270 Davenport St NE Minneapolis, MN 55449
Estimated Value: $357,000 - $381,000
4
Beds
2
Baths
972
Sq Ft
$376/Sq Ft
Est. Value
About This Home
This home is located at 13270 Davenport St NE, Minneapolis, MN 55449 and is currently estimated at $365,634, approximately $376 per square foot. 13270 Davenport St NE is a home located in Anoka County with nearby schools including Johnsville Elementary School, Northdale Middle School, and Blaine Senior High School.
Ownership History
Date
Name
Owned For
Owner Type
Purchase Details
Closed on
Apr 20, 2020
Sold by
Wrazidio Fritz and Wrazidlo Debra
Bought by
Wrazidlo Benjamin Fritz
Current Estimated Value
Home Financials for this Owner
Home Financials are based on the most recent Mortgage that was taken out on this home.
Original Mortgage
$212,800
Outstanding Balance
$148,790
Interest Rate
3.6%
Mortgage Type
New Conventional
Estimated Equity
$216,844
Purchase Details
Closed on
Nov 30, 2018
Sold by
Schaaf Jared M and Schaaf Jenelle L
Bought by
Wrazidlo Fritz and Wrazidlo Debra
Home Financials for this Owner
Home Financials are based on the most recent Mortgage that was taken out on this home.
Original Mortgage
$212,000
Interest Rate
4.8%
Mortgage Type
New Conventional
Purchase Details
Closed on
Jul 25, 2006
Sold by
Austad Keith M and Austad Janica
Bought by
Schaaf Jared M and Schaaf Jenelle L
Create a Home Valuation Report for This Property
The Home Valuation Report is an in-depth analysis detailing your home's value as well as a comparison with similar homes in the area
Home Values in the Area
Average Home Value in this Area
Purchase History
| Date | Buyer | Sale Price | Title Company |
|---|---|---|---|
| Wrazidlo Benjamin Fritz | -- | Stewart Title Company | |
| Wrazidlo Fritz | $265,000 | Liberty Title Inc | |
| Schaaf Jared M | $220,000 | -- |
Source: Public Records
Mortgage History
| Date | Status | Borrower | Loan Amount |
|---|---|---|---|
| Open | Wrazidlo Benjamin Fritz | $212,800 | |
| Closed | Wrazidlo Fritz | $212,000 |
Source: Public Records
Tax History Compared to Growth
Tax History
| Year | Tax Paid | Tax Assessment Tax Assessment Total Assessment is a certain percentage of the fair market value that is determined by local assessors to be the total taxable value of land and additions on the property. | Land | Improvement |
|---|---|---|---|---|
| 2025 | $3,392 | $326,300 | $115,500 | $210,800 |
| 2024 | $3,392 | $314,900 | $113,600 | $201,300 |
| 2023 | $3,145 | $317,500 | $105,000 | $212,500 |
| 2022 | $2,554 | $311,100 | $90,700 | $220,400 |
| 2021 | $2,487 | $245,200 | $75,300 | $169,900 |
| 2020 | $2,568 | $234,300 | $75,300 | $159,000 |
| 2019 | $2,428 | $232,700 | $70,400 | $162,300 |
| 2018 | $2,491 | $216,700 | $0 | $0 |
| 2017 | $2,082 | $202,700 | $0 | $0 |
| 2016 | $2,097 | $164,700 | $0 | $0 |
| 2015 | $2,038 | $164,700 | $55,500 | $109,200 |
| 2014 | -- | $142,400 | $45,000 | $97,400 |
Source: Public Records
Map
Nearby Homes
- 1756 132nd Ave NE
- 1409 131st Ave NE
- 1250 132nd Ln NE
- 13446 Buchanan St NE
- 13018 Ulysses St NE
- 12980 Ulysses St NE
- 1948 130th Ln NE
- 1852 129th Ave NE
- 1876 129th Ave NE
- 1923 136th Ln NE
- 12775 Ulysses Cir NE
- 13649 Pierce St NE
- 1156 128th Ave NE
- XXXX Radisson Rd NE
- 2251 132nd Ct NE
- 13420 Van Buren St NE
- 2253 130th Ct NE
- 2329 130th Ct NE
- 2307 132nd Ln NE
- 12741 Owatonna St NE
- 13256 Davenport St NE
- 13284 Davenport St NE
- 13242 Davenport St NE
- 1601 132nd Ln NE
- 1600 132nd Ln NE
- 13228 Davenport St NE
- 1614 132nd Ln NE
- 13214 Davenport St NE
- 1600 133rd Ln NE
- 1629 132nd Ln NE
- 1628 132nd Ln NE
- 1601 132nd Ave NE
- 1615 132nd Ave NE
- 13200 Davenport St NE
- 1529 132nd Ave NE
- 1629 132nd Ave NE
- 1642 132nd Ln NE
- 1643 132nd Ln NE
- 1515 132nd Ave NE
- 1614 133rd Ln NE