Estimated Value: $1,022,000 - $1,156,000
4
Beds
2
Baths
1,742
Sq Ft
$611/Sq Ft
Est. Value
About This Home
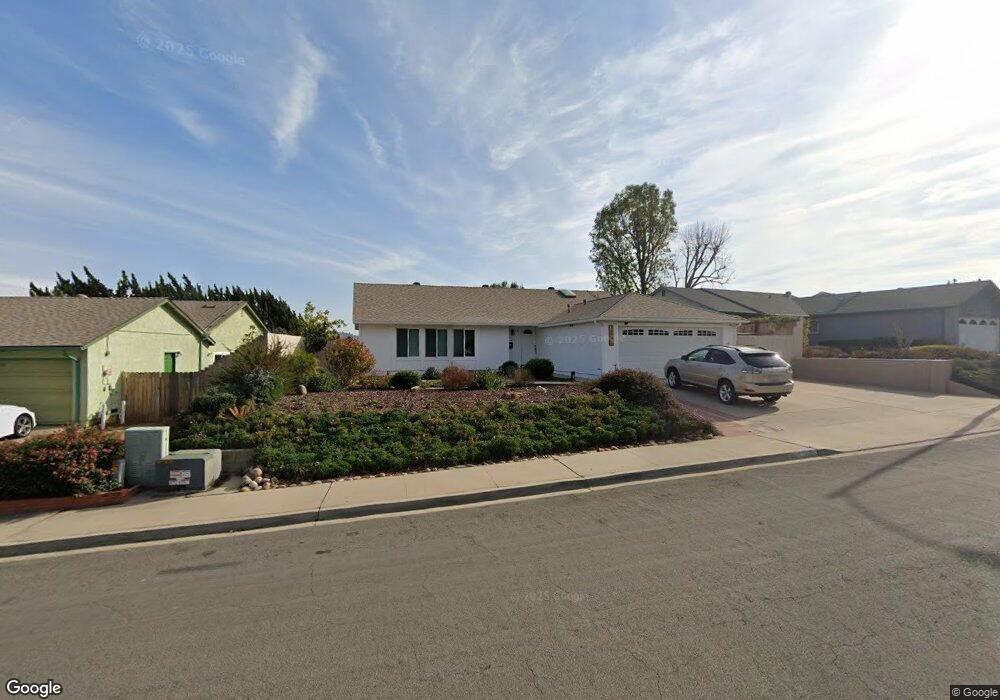
This home is located at 13273 Olive Meadows Dr, Poway, CA 92064 and is currently estimated at $1,063,534, approximately $610 per square foot. 13273 Olive Meadows Dr is a home located in San Diego County with nearby schools including Midland Elementary, Twin Peaks Middle, and Poway High.
Ownership History
Date
Name
Owned For
Owner Type
Purchase Details
Closed on
Nov 24, 2020
Sold by
Ewing Michelle Lee
Bought by
Ewing Michelle Lee and The Michelle Ewing Living Trus
Current Estimated Value
Home Financials for this Owner
Home Financials are based on the most recent Mortgage that was taken out on this home.
Original Mortgage
$222,650
Outstanding Balance
$180,447
Interest Rate
2.8%
Mortgage Type
New Conventional
Estimated Equity
$883,087
Purchase Details
Closed on
Aug 22, 2008
Sold by
Ewing Michelle Lee
Bought by
Ewing Michelle Lee
Purchase Details
Closed on
Nov 7, 2006
Sold by
Ewing Carl Andrew and Ewing Michelle Lee
Bought by
Ewing Michelle Lee
Purchase Details
Closed on
Mar 6, 1995
Sold by
Sikes James R and Sikes Candy
Bought by
Ewing Carl Andrew and Ewing Michelle Lee
Home Financials for this Owner
Home Financials are based on the most recent Mortgage that was taken out on this home.
Original Mortgage
$153,900
Interest Rate
4.62%
Purchase Details
Closed on
Dec 31, 1991
Purchase Details
Closed on
May 27, 1983
Create a Home Valuation Report for This Property
The Home Valuation Report is an in-depth analysis detailing your home's value as well as a comparison with similar homes in the area
Home Values in the Area
Average Home Value in this Area
Purchase History
We collect this data history from publicly available records. To have your information removed, we recommend requesting removal directly through your county’s website.
| Date | Buyer | Sale Price | Title Company |
|---|---|---|---|
| Ewing Michelle Lee | -- | Fidelity National Title Co | |
| Ewing Michelle Lee | -- | Fidelity National Title | |
| Ewing Michelle Lee | -- | None Available | |
| Ewing Michelle Lee | -- | None Available | |
| Ewing Carl Andrew | $162,000 | Stewart Title Company | |
| -- | $176,000 | -- | |
| -- | $112,500 | -- |
Source: Public Records
Mortgage History
We collect this data history from publicly available records. To have your information removed, we recommend requesting removal directly through your county’s website.
| Date | Status | Borrower | Loan Amount |
|---|---|---|---|
| Open | Ewing Michelle Lee | $222,650 | |
| Closed | Ewing Carl Andrew | $153,900 |
Source: Public Records
Tax History
| Year | Tax Paid | Tax Assessment Tax Assessment Total Assessment is a certain percentage of the fair market value that is determined by local assessors to be the total taxable value of land and additions on the property. | Land | Improvement |
|---|---|---|---|---|
| 2025 | $3,611 | $326,519 | $167,955 | $158,564 |
| 2024 | $3,611 | $320,117 | $164,662 | $155,455 |
| 2023 | $3,533 | $313,841 | $161,434 | $152,407 |
| 2022 | $3,474 | $307,688 | $158,269 | $149,419 |
| 2021 | $3,428 | $301,656 | $155,166 | $146,490 |
| 2020 | $3,382 | $298,563 | $153,575 | $144,988 |
| 2019 | $3,295 | $292,710 | $150,564 | $142,146 |
| 2018 | $3,203 | $286,971 | $147,612 | $139,359 |
| 2017 | $170 | $281,345 | $144,718 | $136,627 |
| 2016 | $3,052 | $275,830 | $141,881 | $133,949 |
| 2015 | $3,007 | $271,687 | $139,750 | $131,937 |
| 2014 | $2,937 | $266,366 | $137,013 | $129,353 |
Source: Public Records
Map
Nearby Homes
- 13871 Olive Grove Place
- 13358 Birch Tree Ln
- 14168 Kendra Way
- 13406 Aubrey St
- 13826 Midland Rd
- 13945 Midland Rd
- 12834 Rockwell Ct
- 13557-611 Agsten Ln
- 000 Carlson Ct 9 Unit 9
- 13908 Hibiscus Ave Unit 40
- 13941 Wisteria Ave
- 13050 Tuscarora Dr
- 14003 Jasmine Ave Unit 193
- 14089 Pomegranate Ave Unit 214
- 14009 Eastern St
- 13737 Temple St
- 13056 Poway Rd
- 1/2 Poway Rd
- 13620 Holly Oak Way
- 12875 Carriage Heights Way Unit 12875
- 13269 Olive Meadows Dr
- 13277 Olive Meadows Dr
- 13265 Olive Meadows Dr
- 13281 Olive Meadows Dr
- 13272 Olive Meadows Dr
- 13853 Olive Park Place
- 13276 Olive Meadows Dr
- 13261 Olive Meadows Dr
- 13280 Olive Meadows Dr
- 13850 Olive Park Place
- 13268 Olive Meadows Dr
- 13315 Olive Meadows Dr
- 13849 Olive Park Place
- 13874 Olive Mill Way
- 13264 Olive Meadows Dr
- 13880 Olive Mill Way
- 13848 Olive Park Place
- 13257 Olive Meadows Dr
- 13941 Olive Crest Way
- 14008 Hermosillo Way
Your Personal Tour Guide
Ask me questions while you tour the home.