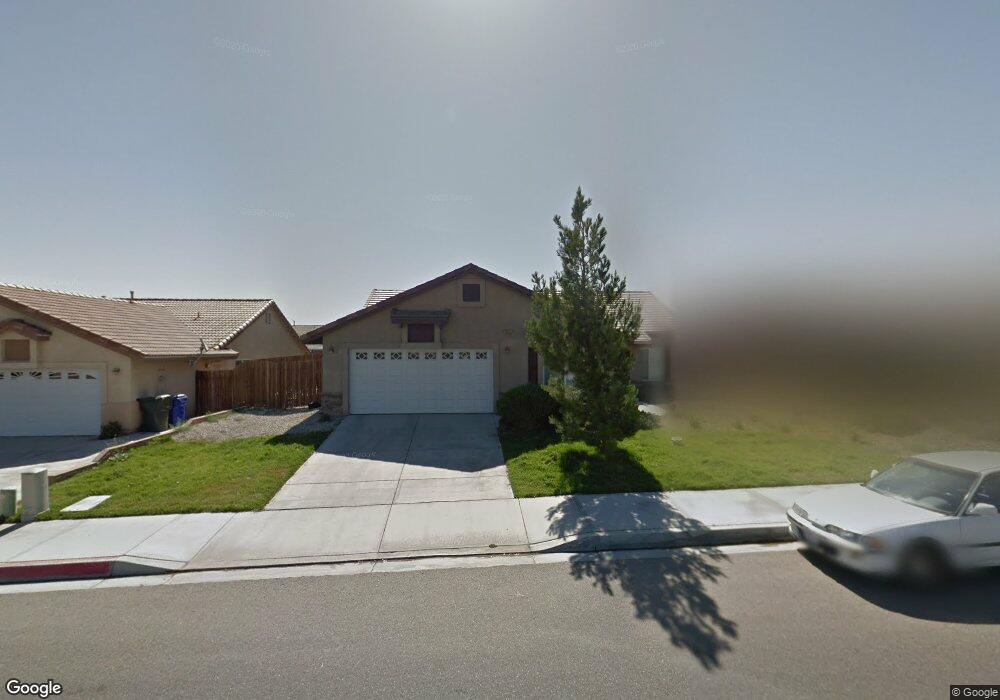
13275 Cypress Ave Victorville, CA 92395
Estimated Value: $441,704 - $461,000
4
Beds
3
Baths
1,995
Sq Ft
$224/Sq Ft
Est. Value
About This Home
This home is located at 13275 Cypress Ave, Victorville, CA 92395 and is currently estimated at $447,426, approximately $224 per square foot. 13275 Cypress Ave is a home located in San Bernardino County with nearby schools including Mojave Vista Elementary School, Lomitas Elementary School, and Lakeview Leadership Academy.
Ownership History
Date
Name
Owned For
Owner Type
Purchase Details
Closed on
Mar 19, 2012
Sold by
Newhope Residential Llc
Bought by
Reyes Salena Nichole and Sena Joe Junior
Current Estimated Value
Home Financials for this Owner
Home Financials are based on the most recent Mortgage that was taken out on this home.
Original Mortgage
$131,577
Interest Rate
4.4%
Mortgage Type
FHA
Purchase Details
Closed on
Jan 31, 2012
Sold by
Kim Roy Yung
Bought by
Newhope Residential Llc
Home Financials for this Owner
Home Financials are based on the most recent Mortgage that was taken out on this home.
Original Mortgage
$131,577
Interest Rate
4.4%
Mortgage Type
FHA
Purchase Details
Closed on
May 18, 2006
Sold by
Victory Homes 1 Inc
Bought by
Kim Roy Yung and Kim Sollmala
Home Financials for this Owner
Home Financials are based on the most recent Mortgage that was taken out on this home.
Original Mortgage
$244,125
Interest Rate
6.25%
Mortgage Type
Purchase Money Mortgage
Create a Home Valuation Report for This Property
The Home Valuation Report is an in-depth analysis detailing your home's value as well as a comparison with similar homes in the area
Home Values in the Area
Average Home Value in this Area
Purchase History
| Date | Buyer | Sale Price | Title Company |
|---|---|---|---|
| Reyes Salena Nichole | $135,000 | Advantage Title Inc | |
| Newhope Residential Llc | $101,300 | Advantage Title Co | |
| Kim Roy Yung | $325,500 | First American Title |
Source: Public Records
Mortgage History
| Date | Status | Borrower | Loan Amount |
|---|---|---|---|
| Previous Owner | Reyes Salena Nichole | $131,577 | |
| Previous Owner | Kim Roy Yung | $244,125 |
Source: Public Records
Tax History Compared to Growth
Tax History
| Year | Tax Paid | Tax Assessment Tax Assessment Total Assessment is a certain percentage of the fair market value that is determined by local assessors to be the total taxable value of land and additions on the property. | Land | Improvement |
|---|---|---|---|---|
| 2025 | $2,066 | $163,287 | $25,121 | $138,166 |
| 2024 | $2,066 | $160,085 | $24,628 | $135,457 |
| 2023 | $2,047 | $156,946 | $24,145 | $132,801 |
| 2022 | $2,014 | $153,869 | $23,672 | $130,197 |
| 2021 | $1,981 | $150,852 | $23,208 | $127,644 |
| 2020 | $1,948 | $149,305 | $22,970 | $126,335 |
| 2019 | $1,918 | $146,378 | $22,520 | $123,858 |
| 2018 | $2,034 | $143,507 | $22,078 | $121,429 |
| 2017 | $1,996 | $140,693 | $21,645 | $119,048 |
| 2016 | $1,959 | $137,935 | $21,221 | $116,714 |
| 2015 | $1,874 | $135,863 | $20,902 | $114,961 |
| 2014 | $1,841 | $133,202 | $20,493 | $112,709 |
Source: Public Records
Map
Nearby Homes
- 15943 Oak Ct
- 13243 Forest Meadow Ln
- 15940 Greyrock St
- 0 Winona St Unit HD25241326
- 13063 Canyon Oak Ct
- 16111 Pablo Ct
- 16112 Pablo Ct
- 16124 Pablo Ct
- 16136 Pablo Ct
- 13229 Plaza Laredo Way
- 16148 Pablo Ct
- 15638 Choctaw St
- 13393 Mariposa Rd
- 13393 Mariposa Rd Unit 7
- 13393 Mariposa Rd Unit 188
- 13393 Mariposa Rd Unit 169
- 13393 Mariposa Rd Unit 108
- 13393 Mariposa Rd Unit 220
- 13115 Sunset Canyon Way
- 14 Arrowhead Dr
- 13285 Cypress Ave
- 13265 Cypress Ave
- 13274 Forest Meadow Ln
- 13284 Forest Meadow Ln
- 13264 Forest Meadow Ln
- 13255 Cypress Ave
- 13254 Forest Meadow Ln
- 13241 Cypress Ave
- 13242 Forest Meadow Ln
- 15907 Oak Ct
- 15919 Oak Ct
- 15952 Holly Brook Rd
- 15931 Oak Ct
- 13231 Cypress Ave
- 13263 Forest Meadow Ln
- 13232 Forest Meadow Ln
- 13253 Forest Meadow Ln
- 15962 Holly Brook Rd
- 15955 Oak Ct
- 13222 Forest Meadow Ln