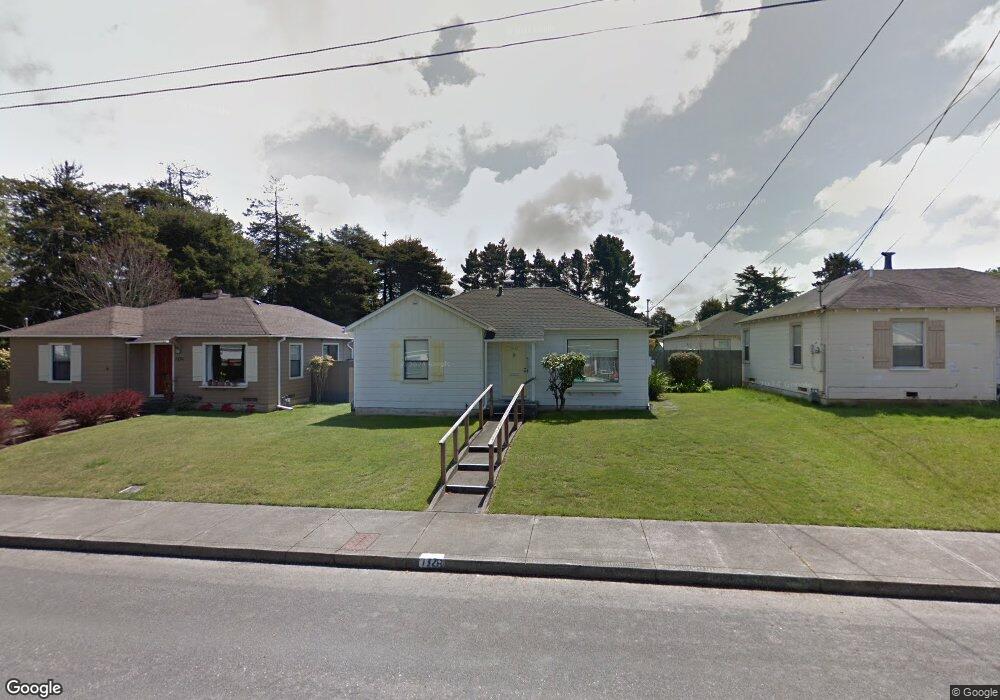
1328 13th St Eureka, CA 95501
City Center NeighborhoodEstimated Value: $303,000 - $408,000
2
Beds
1
Bath
823
Sq Ft
$438/Sq Ft
Est. Value
About This Home
This home is located at 1328 13th St, Eureka, CA 95501 and is currently estimated at $360,526, approximately $438 per square foot. 1328 13th St is a home located in Humboldt County with nearby schools including Washington Elementary School, Catherine L. Zane Middle School, and Eureka Senior High School.
Ownership History
Date
Name
Owned For
Owner Type
Purchase Details
Closed on
Nov 9, 2022
Sold by
Dzur Dianne J
Bought by
Donahue Michael T
Current Estimated Value
Home Financials for this Owner
Home Financials are based on the most recent Mortgage that was taken out on this home.
Original Mortgage
$191,000
Outstanding Balance
$185,066
Interest Rate
6.94%
Mortgage Type
Seller Take Back
Estimated Equity
$175,460
Purchase Details
Closed on
Jan 23, 2015
Sold by
Klamer Kara Lynn M
Bought by
Dzur Dianne J
Create a Home Valuation Report for This Property
The Home Valuation Report is an in-depth analysis detailing your home's value as well as a comparison with similar homes in the area
Home Values in the Area
Average Home Value in this Area
Purchase History
| Date | Buyer | Sale Price | Title Company |
|---|---|---|---|
| Donahue Michael T | $200,000 | Trinity County Title | |
| Dzur Dianne J | $90,000 | Trinity County Title Company |
Source: Public Records
Mortgage History
| Date | Status | Borrower | Loan Amount |
|---|---|---|---|
| Open | Donahue Michael T | $191,000 |
Source: Public Records
Tax History
| Year | Tax Paid | Tax Assessment Tax Assessment Total Assessment is a certain percentage of the fair market value that is determined by local assessors to be the total taxable value of land and additions on the property. | Land | Improvement |
|---|---|---|---|---|
| 2025 | $3,328 | $323,564 | $192,474 | $131,090 |
| 2024 | $3,328 | $317,220 | $188,700 | $128,520 |
| 2023 | $3,281 | $311,000 | $185,000 | $126,000 |
| 2022 | $1,386 | $124,126 | $52,094 | $72,032 |
| 2021 | $1,298 | $121,693 | $51,073 | $70,620 |
| 2020 | $1,289 | $120,446 | $50,550 | $69,896 |
| 2019 | $1,262 | $118,085 | $49,559 | $68,526 |
| 2018 | $1,243 | $115,771 | $48,588 | $67,183 |
| 2017 | $1,237 | $113,502 | $47,636 | $65,866 |
| 2016 | $1,237 | $111,277 | $46,702 | $64,575 |
| 2015 | $439 | $39,213 | $12,002 | $27,211 |
| 2014 | $410 | $38,445 | $11,767 | $26,678 |
Source: Public Records
Map
Nearby Homes
Your Personal Tour Guide
Ask me questions while you tour the home.