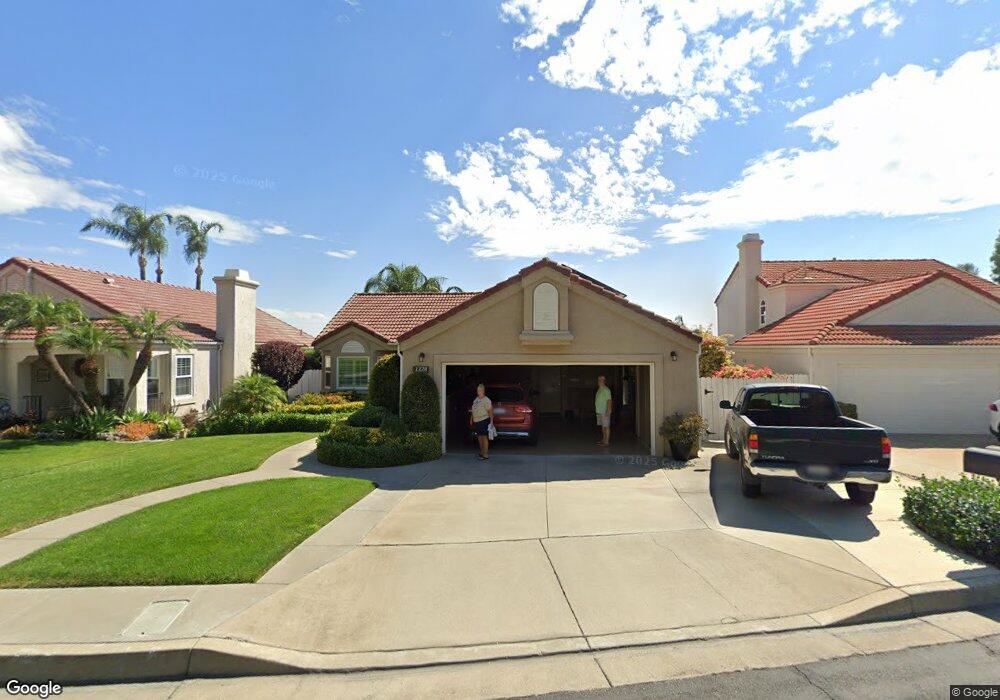
1328 Granada St Upland, CA 91784
Estimated Value: $767,000 - $818,000
3
Beds
2
Baths
1,322
Sq Ft
$600/Sq Ft
Est. Value
About This Home
This home is located at 1328 Granada St, Upland, CA 91784 and is currently estimated at $792,983, approximately $599 per square foot. 1328 Granada St is a home located in San Bernardino County with nearby schools including Valencia Elementary, Pioneer Junior High School, and Upland High School.
Ownership History
Date
Name
Owned For
Owner Type
Purchase Details
Closed on
Mar 29, 2016
Sold by
Boies Lori C and The Lori C Boies Trust
Bought by
Draper Lori R and Draper Jeffrey P
Current Estimated Value
Home Financials for this Owner
Home Financials are based on the most recent Mortgage that was taken out on this home.
Original Mortgage
$298,300
Outstanding Balance
$236,670
Interest Rate
3.64%
Mortgage Type
New Conventional
Estimated Equity
$556,313
Purchase Details
Closed on
Oct 14, 2010
Sold by
Boies Lori
Bought by
Boies Lori C and Lori C Boies Trust
Purchase Details
Closed on
Jun 24, 1998
Sold by
Bradley Stead William R and Bradley Carole Ann
Bought by
Boies Bradley R and Boies Lori
Home Financials for this Owner
Home Financials are based on the most recent Mortgage that was taken out on this home.
Original Mortgage
$107,000
Interest Rate
7.01%
Create a Home Valuation Report for This Property
The Home Valuation Report is an in-depth analysis detailing your home's value as well as a comparison with similar homes in the area
Home Values in the Area
Average Home Value in this Area
Purchase History
| Date | Buyer | Sale Price | Title Company |
|---|---|---|---|
| Draper Lori R | -- | Wfg National Title | |
| Boies Lori C | -- | None Available | |
| Boies Bradley R | -- | First American Title Ins Co |
Source: Public Records
Mortgage History
| Date | Status | Borrower | Loan Amount |
|---|---|---|---|
| Open | Draper Lori R | $298,300 | |
| Previous Owner | Boies Bradley R | $107,000 |
Source: Public Records
Tax History Compared to Growth
Tax History
| Year | Tax Paid | Tax Assessment Tax Assessment Total Assessment is a certain percentage of the fair market value that is determined by local assessors to be the total taxable value of land and additions on the property. | Land | Improvement |
|---|---|---|---|---|
| 2025 | $3,448 | $320,268 | $96,230 | $224,038 |
| 2024 | $3,448 | $313,988 | $94,343 | $219,645 |
| 2023 | $3,393 | $307,831 | $92,493 | $215,338 |
| 2022 | $3,319 | $301,795 | $90,679 | $211,116 |
| 2021 | $3,311 | $295,877 | $88,901 | $206,976 |
| 2020 | $3,221 | $292,843 | $87,989 | $204,854 |
| 2019 | $3,209 | $287,101 | $86,264 | $200,837 |
| 2018 | $2,686 | $233,207 | $81,684 | $151,523 |
| 2017 | $2,609 | $228,634 | $80,082 | $148,552 |
| 2016 | $2,349 | $224,151 | $78,512 | $145,639 |
| 2015 | $2,295 | $220,784 | $77,333 | $143,451 |
| 2014 | $2,235 | $216,459 | $75,818 | $140,641 |
Source: Public Records
Map
Nearby Homes
- 1252 Granada St
- 2279 Wisteria Ave
- 1230 Piedmont Dr
- 2183 Paris Cir
- 2166 Malati Cir
- 2163 Pinot Cir
- 1070 Emerson St
- 1328 Sunrise Cir S
- 2445 Ocean View Dr
- 937 Emerson St
- 2304 Rosedale Curve
- 860 Emerson St
- 1363 Running Creek Ln
- 2335 N San Antonio Ave
- 2048 Birkdale Ave
- 785 W Dalton Ct
- 1992 Moonbeam Cir
- 701 W 24th St
- 907 Pineridge St
- 1992 Windemere Ct
- 1320 Granada St
- 1312 Granada St
- 1315 Mallorca St
- 1323 Mallorca St
- 1331 Mallorca St
- 1340 Granada St
- 1307 Mallorca St
- 2331 Palermo Ave
- 1304 Granada St
- 2335 Palermo Ave
- 1339 Mallorca St
- 1299 Mallorca St
- 1296 Granada St
- 1341 Mallorca St
- 2341 Palermo Ave
- 1293 Mallorca St
- 1318 Mallorca St
- 1310 Mallorca St
- 1288 Granada St
- 1326 Mallorca St