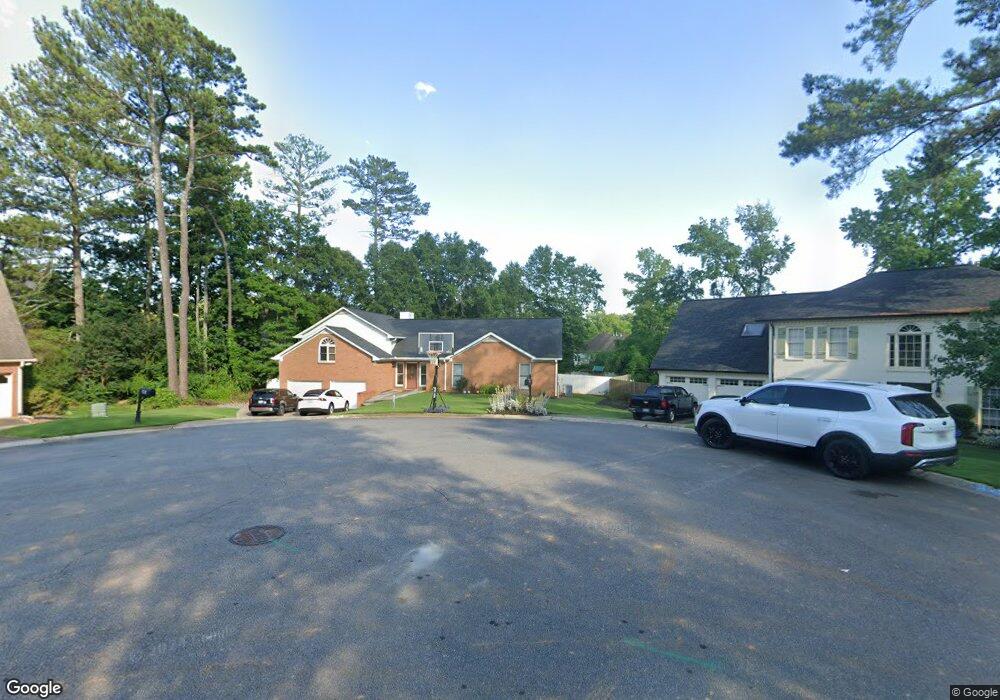
1328 Nonie Way Marietta, GA 30062
East Cobb NeighborhoodEstimated Value: $532,000 - $652,000
4
Beds
3
Baths
2,092
Sq Ft
$293/Sq Ft
Est. Value
About This Home
This home is located at 1328 Nonie Way, Marietta, GA 30062 and is currently estimated at $613,910, approximately $293 per square foot. 1328 Nonie Way is a home located in Cobb County with nearby schools including Murdock Elementary School, Dodgen Middle School, and Walton High School.
Ownership History
Date
Name
Owned For
Owner Type
Purchase Details
Closed on
Feb 24, 2024
Sold by
Verma Manish Kumar and Verma Sanyukta
Bought by
Verma Manish Kumar and Verma Sanyukta
Current Estimated Value
Home Financials for this Owner
Home Financials are based on the most recent Mortgage that was taken out on this home.
Original Mortgage
$529,100
Outstanding Balance
$519,889
Interest Rate
6.69%
Mortgage Type
FHA
Estimated Equity
$94,021
Purchase Details
Closed on
May 30, 2017
Sold by
Wenhua Jin
Bought by
Verma Manish Kumar and Fnu Sanyukta
Home Financials for this Owner
Home Financials are based on the most recent Mortgage that was taken out on this home.
Original Mortgage
$362,280
Interest Rate
4.25%
Mortgage Type
FHA
Purchase Details
Closed on
Aug 11, 2010
Sold by
Nowell Jean B and Nowell Gilbert
Bought by
Jin Wenhua and Yang Ke
Create a Home Valuation Report for This Property
The Home Valuation Report is an in-depth analysis detailing your home's value as well as a comparison with similar homes in the area
Home Values in the Area
Average Home Value in this Area
Purchase History
| Date | Buyer | Sale Price | Title Company |
|---|---|---|---|
| Verma Manish Kumar | -- | None Listed On Document | |
| Verma Manish Kumar | $369,000 | -- | |
| Jin Wenhua | $230,000 | -- |
Source: Public Records
Mortgage History
| Date | Status | Borrower | Loan Amount |
|---|---|---|---|
| Open | Verma Manish Kumar | $529,100 | |
| Previous Owner | Verma Manish Kumar | $362,280 |
Source: Public Records
Tax History Compared to Growth
Tax History
| Year | Tax Paid | Tax Assessment Tax Assessment Total Assessment is a certain percentage of the fair market value that is determined by local assessors to be the total taxable value of land and additions on the property. | Land | Improvement |
|---|---|---|---|---|
| 2025 | $6,250 | $254,120 | $46,000 | $208,120 |
| 2024 | $5,035 | $197,832 | $35,200 | $162,632 |
| 2023 | $4,492 | $197,832 | $35,200 | $162,632 |
| 2022 | $5,072 | $197,832 | $35,200 | $162,632 |
| 2021 | $3,818 | $140,540 | $35,200 | $105,340 |
| 2020 | $3,818 | $140,540 | $35,200 | $105,340 |
| 2019 | $3,818 | $140,540 | $35,200 | $105,340 |
| 2018 | $3,368 | $120,000 | $24,000 | $96,000 |
| 2017 | $3,450 | $120,000 | $24,000 | $96,000 |
| 2016 | $3,978 | $138,380 | $24,000 | $114,380 |
| 2015 | $2,710 | $92,000 | $21,996 | $70,004 |
| 2014 | $2,733 | $92,000 | $0 | $0 |
Source: Public Records
Map
Nearby Homes
- 1246 Stonecroft Way
- 1131 Hershey Dr
- 2868 Octavia Cir
- 0 Holly Springs Rd Unit 7637105
- 0 Holly Springs Rd Unit 10591415
- 2880 Octavia Cir
- 925 Sunny Meadows Ln
- 909 Sunny Meadows Ln
- 1043 Sterling Ridge Chase NE
- 1043 Sterling Ridge Chase
- 2672 Roswell Rd
- 2994 Octavia Cir
- 2650 Roswell Rd
- 1686 N Cobb Pkwy
- 2764 Brookcliff Landing
- 1120 Taliwa Trail NE
- 1519 Brookcliff Cir
- 0 Old Canton Rd NE Unit 10567243
- 0 Old Canton Rd NE Unit 7617214
- 2988 Nestle Creek Dr
- 1326 Nonie Way
- 1245 Stonecroft Way
- 1330 Nonie Way Unit 1
- 0 None Unit 7321325
- 2691 Octavia Ln
- 1255 Stonecroft Way
- 1325 Nonie Way
- 2701 Octavia Ln
- 2681 Octavia Ln
- 1235 Stonecroft Way
- 1334 Nonie Way
- 1327 Nonie Way
- 2715 Octavia Ln
- 1265 Stonecroft Way
- 2665 Octavia Ln
- 1333 Nonie Way
- 2727 Octavia Ln
- 1275 Stonecroft Way
- 2653 Octavia Ln
- 1337 Nonie Way