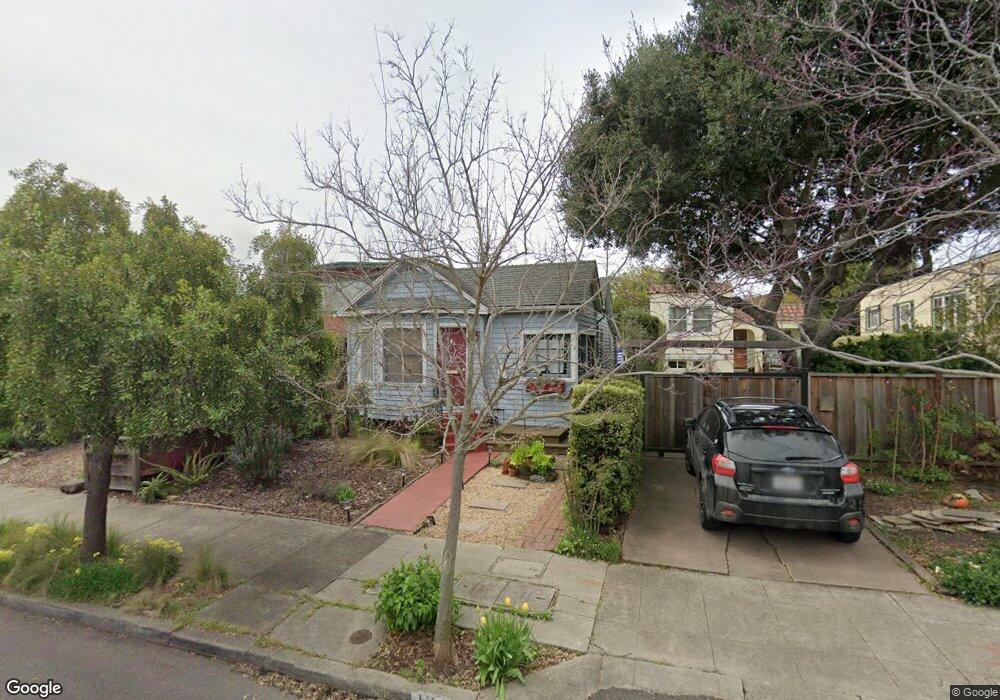
1328 Stannage Ave Berkeley, CA 94702
West Berkeley NeighborhoodEstimated Value: $724,000 - $943,000
1
Bed
1
Bath
598
Sq Ft
$1,369/Sq Ft
Est. Value
About This Home
This home is located at 1328 Stannage Ave, Berkeley, CA 94702 and is currently estimated at $818,623, approximately $1,368 per square foot. 1328 Stannage Ave is a home located in Alameda County with nearby schools including Ruth Acty Elementary, Rosa Parks Elementary School, and Thousand Oaks Elementary School.
Ownership History
Date
Name
Owned For
Owner Type
Purchase Details
Closed on
Mar 15, 2021
Sold by
Brosamer Mark S
Bought by
Lankford Ashby Rachel Brosamer
Current Estimated Value
Purchase Details
Closed on
Nov 5, 2002
Sold by
Parker Margaret L
Bought by
Brosamer Mark S
Home Financials for this Owner
Home Financials are based on the most recent Mortgage that was taken out on this home.
Original Mortgage
$268,000
Outstanding Balance
$111,675
Interest Rate
5.95%
Estimated Equity
$706,948
Purchase Details
Closed on
Jan 10, 1994
Sold by
Colby Michael D and Josephson Gary
Bought by
Parker Margaret L and Parker Dana L
Home Financials for this Owner
Home Financials are based on the most recent Mortgage that was taken out on this home.
Original Mortgage
$141,600
Interest Rate
7.16%
Create a Home Valuation Report for This Property
The Home Valuation Report is an in-depth analysis detailing your home's value as well as a comparison with similar homes in the area
Home Values in the Area
Average Home Value in this Area
Purchase History
| Date | Buyer | Sale Price | Title Company |
|---|---|---|---|
| Lankford Ashby Rachel Brosamer | -- | None Available | |
| Brosamer Mark S | $335,000 | First American Title | |
| Parker Margaret L | $177,000 | Chicago Title Company |
Source: Public Records
Mortgage History
| Date | Status | Borrower | Loan Amount |
|---|---|---|---|
| Open | Brosamer Mark S | $268,000 | |
| Previous Owner | Parker Margaret L | $141,600 |
Source: Public Records
Tax History
| Year | Tax Paid | Tax Assessment Tax Assessment Total Assessment is a certain percentage of the fair market value that is determined by local assessors to be the total taxable value of land and additions on the property. | Land | Improvement |
|---|---|---|---|---|
| 2025 | $7,302 | $485,146 | $145,544 | $339,602 |
| 2024 | $7,302 | $475,635 | $142,690 | $332,945 |
| 2023 | $7,151 | $466,312 | $139,893 | $326,419 |
| 2022 | $7,029 | $457,170 | $137,151 | $320,019 |
| 2021 | $7,046 | $448,208 | $134,462 | $313,746 |
| 2020 | $6,700 | $443,616 | $133,085 | $310,531 |
| 2019 | $6,467 | $434,920 | $130,476 | $304,444 |
| 2018 | $6,363 | $426,394 | $127,918 | $298,476 |
| 2017 | $6,128 | $418,035 | $125,410 | $292,625 |
| 2016 | $5,947 | $409,841 | $122,952 | $286,889 |
| 2015 | $5,871 | $403,687 | $121,106 | $282,581 |
| 2014 | $5,838 | $395,781 | $118,734 | $277,047 |
Source: Public Records
Map
Nearby Homes
- 1234 Stannage Ave
- 1339 Kains Ave
- 1207 Cornell Ave
- 1213 San Pablo Ave
- 1114 Talbot Ave
- 1127 Key Route Blvd
- 1120 Curtis St
- 1050 Kains Ave Unit B1(3)
- 921 Jones St
- 1509 Francis St
- 1136 Marin Ave
- 1036 Ramona Ave
- 1631 Belvedere Ave
- 1368 Rose St
- 817 Jones St
- 995 Virginia St
- 986 Kains Ave
- 1728 Curtis St
- 1322 Virginia St
- 0 Camelia St Unit 41104882
- 1324 Stannage Ave
- 1330 Stannage Ave
- 1322 Stannage Ave
- 1334 Stannage Ave
- 1320 Stannage Ave
- 1331 Kains Ave
- 1327 Kains Ave
- 1333 Kains Ave
- 1336 Stannage Ave
- 1323 Kains Ave
- 1318 Stannage Ave
- 1335 Kains Ave
- 1321 Kains Ave
- 1338 Stannage Ave
- 1331 Stannage Ave
- 1329 Stannage Ave
- 1333 Stannage Ave
- 1325 Stannage Ave
- 1314 Stannage Ave
- 1319 Kains Ave
Your Personal Tour Guide
Ask me questions while you tour the home.