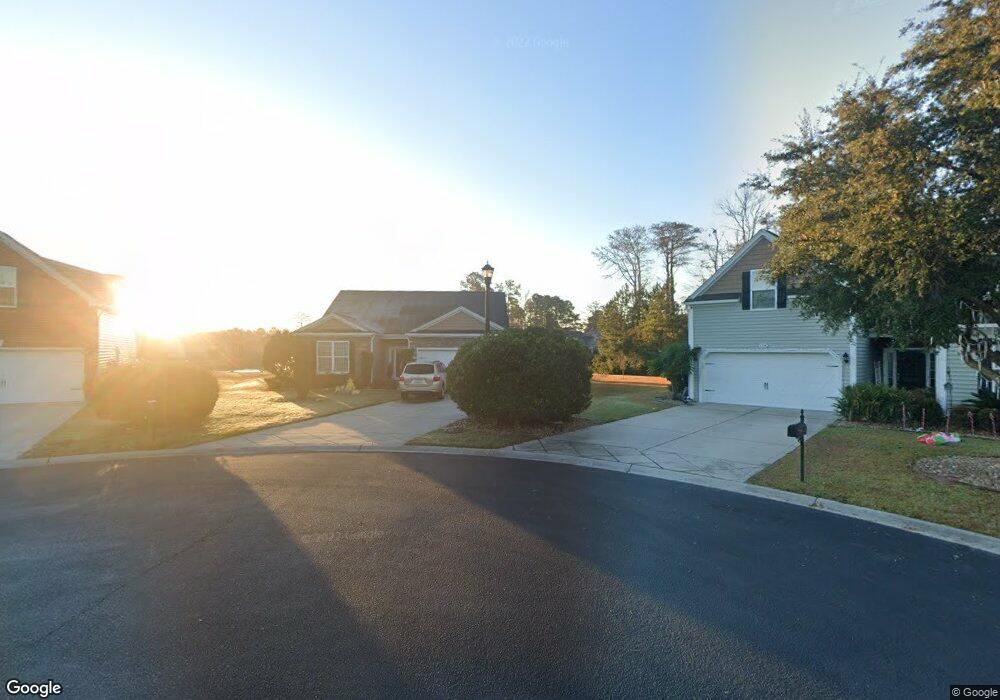
1328 Wellfound Ct Unit Lot 9 Conway, SC 29526
Estimated Value: $303,881 - $336,000
3
Beds
2
Baths
2,088
Sq Ft
$155/Sq Ft
Est. Value
About This Home
This home is located at 1328 Wellfound Ct Unit Lot 9, Conway, SC 29526 and is currently estimated at $323,220, approximately $154 per square foot. 1328 Wellfound Ct Unit Lot 9 is a home located in Horry County with nearby schools including Carolina Forest Elementary School, Ten Oaks Middle, and Carolina Forest High School.
Ownership History
Date
Name
Owned For
Owner Type
Purchase Details
Closed on
Jun 23, 2016
Sold by
Horton Christopher S
Bought by
Winterhalter Terri L and Winterhalter Reinold
Current Estimated Value
Home Financials for this Owner
Home Financials are based on the most recent Mortgage that was taken out on this home.
Original Mortgage
$148,000
Outstanding Balance
$118,060
Interest Rate
3.64%
Estimated Equity
$205,160
Purchase Details
Closed on
Dec 10, 2013
Sold by
Lawrence George M
Bought by
Horton Christopher Seth
Home Financials for this Owner
Home Financials are based on the most recent Mortgage that was taken out on this home.
Original Mortgage
$151,050
Interest Rate
4.16%
Mortgage Type
New Conventional
Purchase Details
Closed on
May 10, 2011
Sold by
Dr Horton
Bought by
Lawrence George M
Create a Home Valuation Report for This Property
The Home Valuation Report is an in-depth analysis detailing your home's value as well as a comparison with similar homes in the area
Home Values in the Area
Average Home Value in this Area
Purchase History
| Date | Buyer | Sale Price | Title Company |
|---|---|---|---|
| Winterhalter Terri L | $185,000 | -- | |
| Horton Christopher Seth | $159,000 | -- | |
| Horton Christopher Seth | $159,000 | -- | |
| Lawrence George M | $151,550 | -- |
Source: Public Records
Mortgage History
| Date | Status | Borrower | Loan Amount |
|---|---|---|---|
| Open | Winterhalter Terri L | $148,000 | |
| Closed | Winterhalter Terri L | $148,000 | |
| Previous Owner | Horton Christopher Seth | $151,050 |
Source: Public Records
Tax History Compared to Growth
Tax History
| Year | Tax Paid | Tax Assessment Tax Assessment Total Assessment is a certain percentage of the fair market value that is determined by local assessors to be the total taxable value of land and additions on the property. | Land | Improvement |
|---|---|---|---|---|
| 2024 | -- | $11,135 | $3,217 | $7,918 |
| 2023 | $830 | $7,550 | $1,434 | $6,116 |
| 2021 | $804 | $7,550 | $1,434 | $6,116 |
| 2020 | $701 | $7,550 | $1,434 | $6,116 |
| 2019 | $701 | $7,550 | $1,434 | $6,116 |
| 2018 | $0 | $7,100 | $1,404 | $5,696 |
| 2017 | $666 | $7,100 | $1,404 | $5,696 |
| 2016 | $0 | $5,632 | $1,404 | $4,228 |
| 2015 | -- | $5,633 | $1,405 | $4,228 |
| 2014 | $493 | $5,633 | $1,405 | $4,228 |
Source: Public Records
Map
Nearby Homes
- 804 Wylie Ct
- 320 Myrtle Greens Dr Unit 320-A
- 800 Wilcot Branch Ct
- 110 Cart Crossing Dr Unit 102
- 300-J Myrtle Greens Dr Unit 300 J
- 412 Wellman Ct
- 150 Cart Crossing Dr Unit 103
- 400 Myrtle Greens Dr Unit C
- 480 Myrtle Greens Dr Unit G
- 425 Myrtle Greens Dr Unit B
- 419 Wellman Ct
- 145 Ridge Point Dr
- 891 Helms Way
- Lot 11 Professional Park Dr
- 904 Helms Way
- 1109 Woodford Ct
- 125 Westville Dr
- 827 Helms Way
- 100 Willow Green Dr Unit A
- 208 Lander Dr
- 1328 Wellfound Ct
- 1328 Wellfound Ct Unit Lot 9 West Ridge
- 1327 Wellfound Ct Unit LT 10 Savannah E
- 1324 Wellfound Ct
- 8109 Timber Ridge Rd
- 1320 Wellfound Ct
- 8111 Timber Ridge Rd
- 8107 Timber Ridge Rd
- 8113 Timber Ridge Rd
- 643 Woodman Dr
- 1316 Wellfound Ct
- 1316 Wellfound Ct Unit lot 6
- 1316 Wellfound Ct Unit lot 6-Mackenzie plan
- 650 Woodman Dr Unit 650 Woodman Drive
- 650 Woodman Dr Unit lot 102-Soapstone Pl
- 646 Woodman Dr
- 646 Woodman Dr Unit lot 101 -Mackenzie
- 8105 Timber Ridge Rd
- 654 Woodman Dr Unit Lt. 103 -Palmetto F
- 639 Woodman Dr