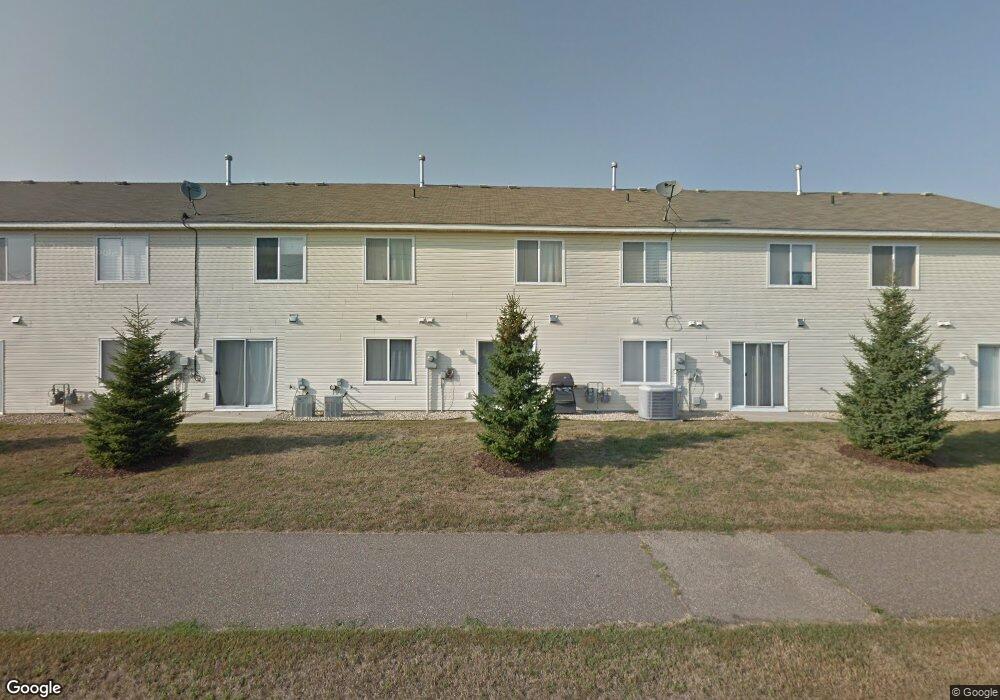
1328 Willow Trail Farmington, MN 55024
Estimated Value: $256,000 - $266,931
3
Beds
2
Baths
1,744
Sq Ft
$149/Sq Ft
Est. Value
About This Home
This home is located at 1328 Willow Trail, Farmington, MN 55024 and is currently estimated at $259,733, approximately $148 per square foot. 1328 Willow Trail is a home located in Dakota County with nearby schools including Farmington Elementary School, Robert Boeckman Middle School, and Farmington High School.
Ownership History
Date
Name
Owned For
Owner Type
Purchase Details
Closed on
Oct 29, 2021
Sold by
Kohler Donald
Bought by
Weng Tony
Current Estimated Value
Home Financials for this Owner
Home Financials are based on the most recent Mortgage that was taken out on this home.
Original Mortgage
$125,400
Outstanding Balance
$97,224
Interest Rate
2.23%
Mortgage Type
New Conventional
Estimated Equity
$162,509
Purchase Details
Closed on
Dec 16, 2016
Sold by
Hsbc Bank Usa Na
Bought by
Berg Nicholas
Purchase Details
Closed on
May 13, 2016
Sold by
Kleiser Kevin and Kleiser Rebecca
Bought by
Hsbc Bank Usa National Association
Purchase Details
Closed on
Mar 31, 2006
Sold by
Mw Johnson Construction Inc
Bought by
Kleiser Kevin M and Kleiser Rebecca M
Purchase Details
Closed on
Jul 15, 2005
Sold by
Sas Development Llc
Bought by
M W Johnson Construction Inc
Create a Home Valuation Report for This Property
The Home Valuation Report is an in-depth analysis detailing your home's value as well as a comparison with similar homes in the area
Home Values in the Area
Average Home Value in this Area
Purchase History
| Date | Buyer | Sale Price | Title Company |
|---|---|---|---|
| Weng Tony | $228,000 | Watermark Title Agency | |
| Berg Nicholas | $118,650 | Title365 | |
| Hsbc Bank Usa National Association | $190,229 | Attorney | |
| Kleiser Kevin M | $188,900 | -- | |
| M W Johnson Construction Inc | $292,000 | -- |
Source: Public Records
Mortgage History
| Date | Status | Borrower | Loan Amount |
|---|---|---|---|
| Open | Weng Tony | $125,400 |
Source: Public Records
Tax History Compared to Growth
Tax History
| Year | Tax Paid | Tax Assessment Tax Assessment Total Assessment is a certain percentage of the fair market value that is determined by local assessors to be the total taxable value of land and additions on the property. | Land | Improvement |
|---|---|---|---|---|
| 2024 | $3,108 | $250,900 | $47,200 | $203,700 |
| 2023 | $3,108 | $255,200 | $45,900 | $209,300 |
| 2022 | $2,626 | $240,500 | $45,800 | $194,700 |
| 2021 | $2,538 | $200,800 | $39,800 | $161,000 |
| 2020 | $2,514 | $193,600 | $37,900 | $155,700 |
| 2019 | $2,260 | $185,600 | $35,200 | $150,400 |
| 2018 | $2,043 | $167,100 | $32,600 | $134,500 |
| 2017 | $2,616 | $150,000 | $30,200 | $119,800 |
| 2016 | $2,727 | $134,200 | $28,800 | $105,400 |
| 2015 | $2,232 | $105,114 | $22,053 | $83,061 |
| 2014 | -- | $83,968 | $18,878 | $65,090 |
| 2013 | -- | $70,016 | $15,796 | $54,220 |
Source: Public Records
Map
Nearby Homes
- 1309 Prairie View Trail
- 201 12th St
- 1200 Willow Trail
- 1321 Elm St
- 3060 212th St W
- 25 Willow Way
- 273 15th St
- 21115 Cameron Way
- 2857 213th St W
- 36 Pine Place
- 803 Pine St
- 1589 Spruce St
- 2701 213th St W
- 905 Spruce St
- 1601 Spruce St
- 21020 Chippendale Ct
- 1604 Spruce St
- 1675 Spruce St
- 1703 Spruce St
- 1763 Spruce St
- 1332 Willow Trail
- 1324 Willow Trail
- 1320 Willow Trail
- 1336 Willow Trail
- 1316 Willow Trail
- 57 Arbor Ln
- 1340 Willow Trail
- 1312 Willow Trail
- 53 Arbor Ln
- 1349 Willow Trail
- 1344 Willow Trail
- 1308 Willow Trail
- 1313 Willow Trail
- 1300 Birch Ct
- 49 Arbor Ln
- 1301 Birch Ct
- 1353 Willow Trail
- 1348 Willow Trail
- 1304 Willow Trail
- 1309 Willow Trail