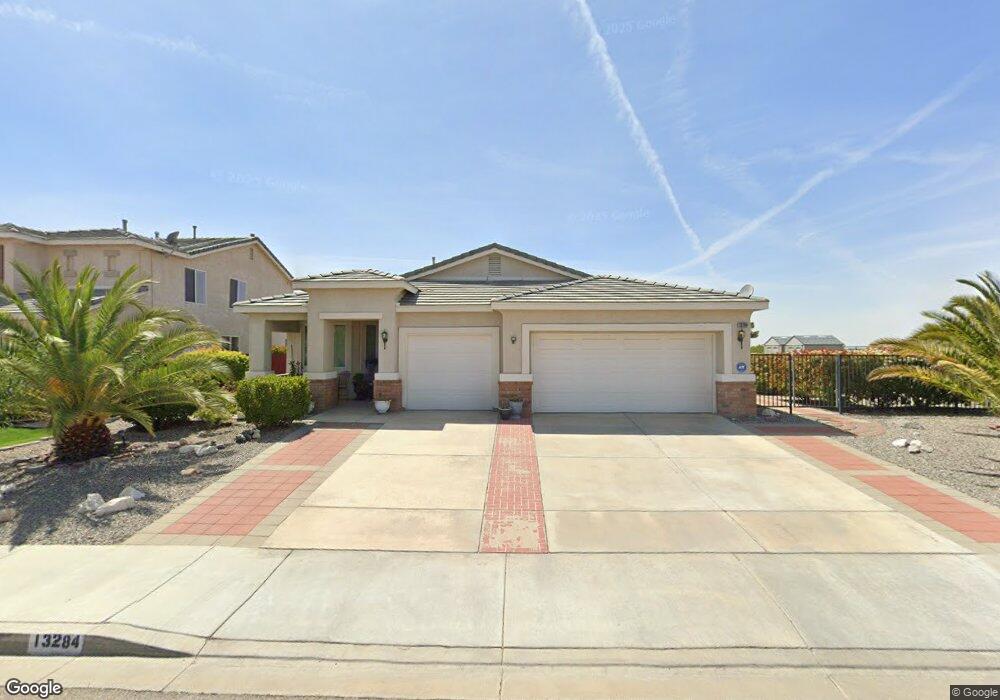
13284 High Mesa Victorville, CA 92395
Estimated Value: $432,000 - $483,000
4
Beds
2
Baths
2,097
Sq Ft
$219/Sq Ft
Est. Value
About This Home
This home is located at 13284 High Mesa, Victorville, CA 92395 and is currently estimated at $460,073, approximately $219 per square foot. 13284 High Mesa is a home located in San Bernardino County with nearby schools including Lomitas Elementary School, Mojave Vista Elementary School, and Lakeview Leadership Academy.
Ownership History
Date
Name
Owned For
Owner Type
Purchase Details
Closed on
Aug 14, 2023
Sold by
Kakes Richard
Bought by
Rins Llc
Current Estimated Value
Purchase Details
Closed on
Jul 10, 2009
Sold by
Wachovia Mortgage Fsb
Bought by
Kakes Richard
Purchase Details
Closed on
Jun 17, 2009
Sold by
Smith Stephanie
Bought by
Wachovia Mortgage Fsb and World Savings Bank
Purchase Details
Closed on
Nov 18, 2004
Sold by
Barnes Bret Lee
Bought by
Smith Stephanie
Home Financials for this Owner
Home Financials are based on the most recent Mortgage that was taken out on this home.
Original Mortgage
$202,236
Interest Rate
5.77%
Mortgage Type
Stand Alone First
Purchase Details
Closed on
Nov 10, 2004
Sold by
Spring Valley Ridge
Bought by
Smith Stephanie
Home Financials for this Owner
Home Financials are based on the most recent Mortgage that was taken out on this home.
Original Mortgage
$202,236
Interest Rate
5.77%
Mortgage Type
Stand Alone First
Create a Home Valuation Report for This Property
The Home Valuation Report is an in-depth analysis detailing your home's value as well as a comparison with similar homes in the area
Home Values in the Area
Average Home Value in this Area
Purchase History
| Date | Buyer | Sale Price | Title Company |
|---|---|---|---|
| Rins Llc | -- | None Listed On Document | |
| Kakes Richard | $141,000 | Fidelity National Title Co | |
| Wachovia Mortgage Fsb | $110,700 | None Available | |
| Smith Stephanie | -- | Landamerica | |
| Smith Stephanie | $253,000 | Landamerica |
Source: Public Records
Mortgage History
| Date | Status | Borrower | Loan Amount |
|---|---|---|---|
| Previous Owner | Smith Stephanie | $202,236 |
Source: Public Records
Tax History Compared to Growth
Tax History
| Year | Tax Paid | Tax Assessment Tax Assessment Total Assessment is a certain percentage of the fair market value that is determined by local assessors to be the total taxable value of land and additions on the property. | Land | Improvement |
|---|---|---|---|---|
| 2025 | $2,512 | $182,005 | $38,725 | $143,280 |
| 2024 | $2,512 | $178,437 | $37,966 | $140,471 |
| 2023 | $2,491 | $174,939 | $37,222 | $137,717 |
| 2022 | $2,454 | $171,509 | $36,492 | $135,017 |
| 2021 | $2,405 | $168,146 | $35,776 | $132,370 |
| 2020 | $2,368 | $166,422 | $35,409 | $131,013 |
| 2019 | $2,335 | $163,159 | $34,715 | $128,444 |
| 2018 | $2,464 | $159,959 | $34,034 | $125,925 |
| 2017 | $2,421 | $156,823 | $33,367 | $123,456 |
| 2016 | $2,380 | $153,748 | $32,713 | $121,035 |
| 2015 | $2,279 | $151,439 | $32,222 | $119,217 |
| 2014 | $2,241 | $148,473 | $31,591 | $116,882 |
Source: Public Records
Map
Nearby Homes
- 17705 Vista Point Dr
- 17725 Vista Point Dr
- 13430 Jubilee Place
- 13432 Jubilee Place
- 13415 Hidden Valley Rd
- 13250 Yellowstone Ave
- 13135 Yellowstone Ave
- 13486 Jubilee Place
- 13090 Yellowstone Ave
- 13290 Rain Shadow Rd
- 17755 Rancho Bonita Rd
- 13330 Tamarisk Rd
- 13220 Tamarisk Rd
- 17800 Rancho Bonita Rd
- 13295 Tamarisk Rd
- 13425 Chinquapin Dr
- 13190 Palos Grande Dr
- 17970 Vista Point Dr
- 13570 Chinquapin Dr
- 13610 Sierra Vista Dr
- 13274 High Mesa
- 1 Bluff Crest St
- 13264 High Mesa
- 17627 Benton Way
- 17619 Benton Way
- 13270 High Crest Rd
- 13254 High Mesa
- 13280 High Crest Rd
- 13260 High Crest Rd
- 13244 High Mesa
- 17652 High Valley
- 17652 High Valley
- 0 Bluff Crest St Unit EV18061711
- 0 Bluff Crest St Unit HD24058922
- 0 Bluff Crest St Unit SW23074126
- 0 Bluff Crest St Unit 532307
- 0 Bluff Crest St Unit 377003
- 0 Bluff Crest St Unit 420932
- 0 Bluff Crest St Unit EV19042382
- 0 Bluff Crest St Unit 517938