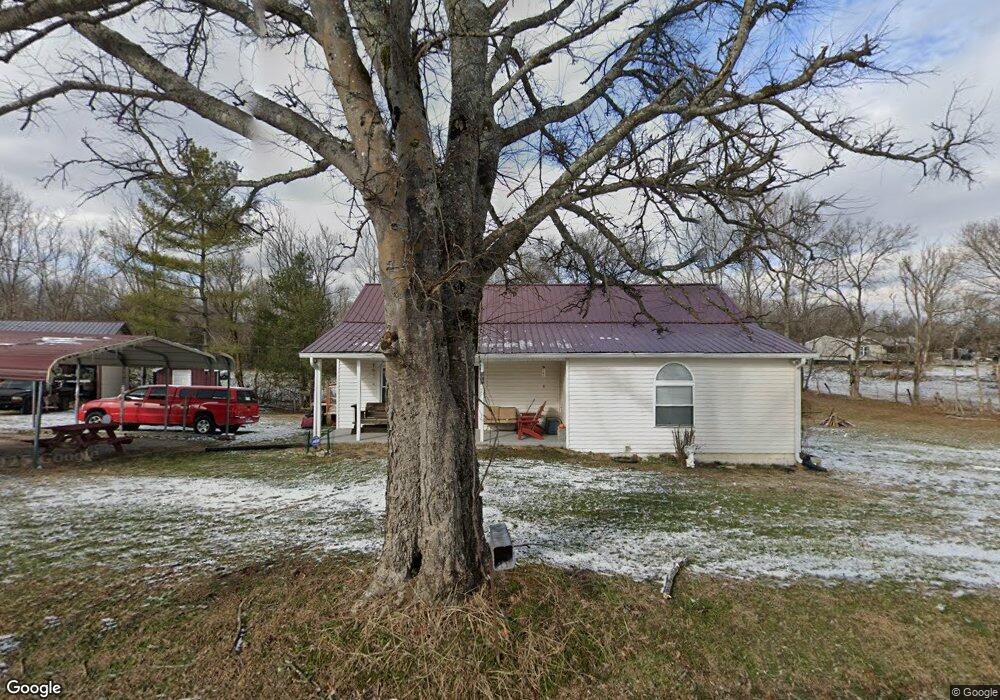
13287 Old Baxter Rd Silver Point, TN 38582
Estimated Value: $170,175 - $306,000
--
Bed
2
Baths
1,664
Sq Ft
$134/Sq Ft
Est. Value
About This Home
This home is located at 13287 Old Baxter Rd, Silver Point, TN 38582 and is currently estimated at $223,044, approximately $134 per square foot. 13287 Old Baxter Rd is a home located in Putnam County with nearby schools including Baxter Primary School, Cornerstone Elementary School, and Upperman Middle School.
Ownership History
Date
Name
Owned For
Owner Type
Purchase Details
Closed on
Jul 5, 2007
Sold by
Dale Smith Philip
Bought by
Edwards Richard A
Current Estimated Value
Home Financials for this Owner
Home Financials are based on the most recent Mortgage that was taken out on this home.
Original Mortgage
$66,950
Outstanding Balance
$41,890
Interest Rate
6.52%
Estimated Equity
$181,154
Purchase Details
Closed on
Sep 11, 2001
Sold by
Wendell Phillips and Wendell Lois
Bought by
Smith Philip D and Dean Daka Dean
Purchase Details
Closed on
Mar 12, 1990
Bought by
Phillips Wendell and Phillips Lois
Purchase Details
Closed on
Mar 13, 1939
Bought by
Shanks Shanks F and Shanks Eldra
Purchase Details
Closed on
Mar 4, 1938
Create a Home Valuation Report for This Property
The Home Valuation Report is an in-depth analysis detailing your home's value as well as a comparison with similar homes in the area
Home Values in the Area
Average Home Value in this Area
Purchase History
| Date | Buyer | Sale Price | Title Company |
|---|---|---|---|
| Edwards Richard A | $66,950 | -- | |
| Smith Philip D | $68,000 | -- | |
| Phillips Wendell | $20,000 | -- | |
| Shanks Shanks F | -- | -- | |
| -- | -- | -- |
Source: Public Records
Mortgage History
| Date | Status | Borrower | Loan Amount |
|---|---|---|---|
| Open | Not Available | $66,950 |
Source: Public Records
Tax History Compared to Growth
Tax History
| Year | Tax Paid | Tax Assessment Tax Assessment Total Assessment is a certain percentage of the fair market value that is determined by local assessors to be the total taxable value of land and additions on the property. | Land | Improvement |
|---|---|---|---|---|
| 2024 | $620 | $23,300 | $2,675 | $20,625 |
| 2023 | $620 | $23,300 | $2,675 | $20,625 |
| 2022 | $576 | $23,300 | $2,675 | $20,625 |
| 2021 | $576 | $23,300 | $2,675 | $20,625 |
| 2020 | $526 | $23,300 | $2,675 | $20,625 |
| 2019 | $526 | $17,975 | $2,675 | $15,300 |
| 2018 | $491 | $17,975 | $2,675 | $15,300 |
| 2017 | $491 | $17,975 | $2,675 | $15,300 |
| 2016 | $491 | $17,975 | $2,675 | $15,300 |
| 2015 | $504 | $17,975 | $2,675 | $15,300 |
| 2014 | $463 | $16,503 | $0 | $0 |
Source: Public Records
Map
Nearby Homes
- 13276 Old Baxter Rd
- 13660 Herald Rd
- 6.33 Ac Old Baxter Rd
- 0 Old Baxter Rd
- 14400 Old Baxter Rd
- 4700 Herrens Chapel Rd
- 6826 Smithville Hwy
- 00 Smithville Hwy 5 01 Acs
- 655 Burton Ridge Rd
- 3944 Crawford Rd
- 0 Buffalo Valley Rd
- 19 Harbor Pointe Dr
- 1 Acre Lafever Ridge Rd
- 0 Hwy 56 Unit RTC3012431
- 0 Lafever Ridge Rd Unit RTC2899996
- 2585 Pow Rd
- 8298 Southfork Rd
- 0
- 9155 Fox Hill Rd
- 13311 Old Baxter Rd
- 6027 Carrs Chapel Rd
- 13335 Old Baxter Rd
- 6059 Carrs Chapel Rd
- 00 Chapel Rd
- 8.5 AC Chapel Rd
- 13310 Old Baxter Rd
- 13339 Old Baxter Rd
- 13187 Old Baxter Rd
- 6091 Carrs Chapel Rd
- 13343 Old Baxter Rd
- 6095 Carrs Chapel Rd
- 13458 Old Baxter Rd
- 13482 Old Baxter Rd
- 6205 Tonce Carter Rd
- 6269 Tonce Carter Rd
- 6360 Tonce Carter Rd
- 13020 Old Baxter Rd
- 6317 Carrs Chapel Rd
- 6317 Carr Chapel