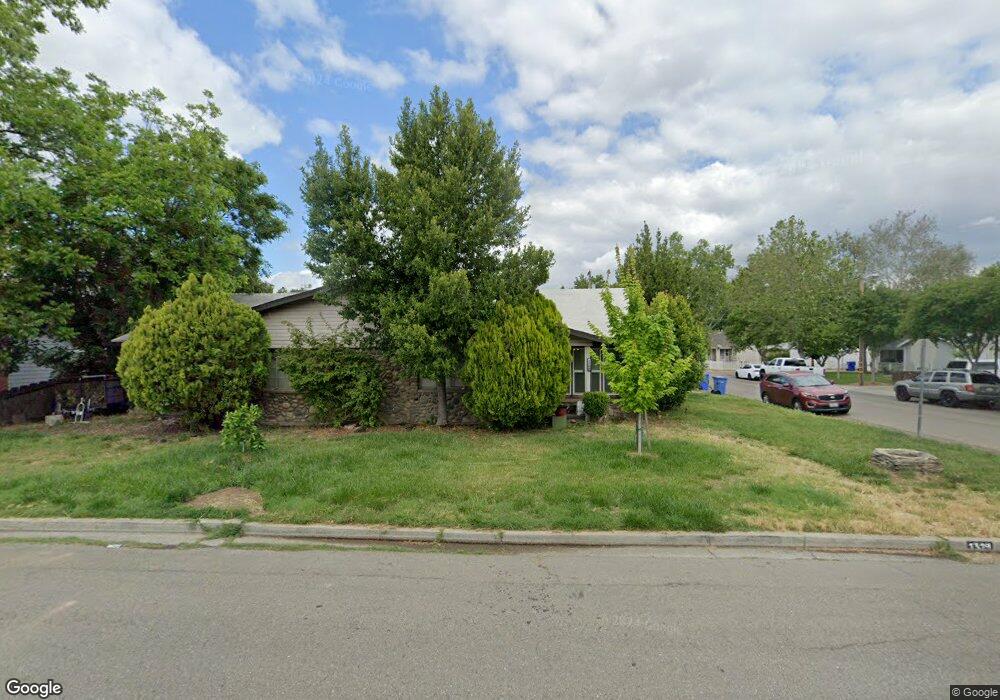
1329 Cooper Ave Turlock, CA 95380
Downtown Turlock NeighborhoodEstimated Value: $500,338 - $516,000
2
Beds
2
Baths
2,912
Sq Ft
$175/Sq Ft
Est. Value
About This Home
This home is located at 1329 Cooper Ave, Turlock, CA 95380 and is currently estimated at $508,169, approximately $174 per square foot. 1329 Cooper Ave is a home located in Stanislaus County with nearby schools including Julien Elementary School, Marvin A. Dutcher Middle School, and Turlock Junior High School.
Ownership History
Date
Name
Owned For
Owner Type
Purchase Details
Closed on
Feb 14, 2022
Sold by
Potter William F
Bought by
Potter William F and Potter Shannon A
Current Estimated Value
Purchase Details
Closed on
Jun 4, 1999
Sold by
Burroughs Wilda M Trustee and Aurora Trust
Bought by
Potter William F
Home Financials for this Owner
Home Financials are based on the most recent Mortgage that was taken out on this home.
Original Mortgage
$121,600
Interest Rate
7.01%
Mortgage Type
Commercial
Purchase Details
Closed on
Aug 10, 1994
Sold by
Bode Virgil and Burroughs Wilda M
Bought by
Burroughs Wilda M and The Aurora Trust #2
Home Financials for this Owner
Home Financials are based on the most recent Mortgage that was taken out on this home.
Original Mortgage
$65,000
Interest Rate
7.12%
Mortgage Type
Commercial
Purchase Details
Closed on
Jul 20, 1994
Sold by
Burroughs Wilda M
Bought by
Bode Virgil and Burroughs Wilda M
Home Financials for this Owner
Home Financials are based on the most recent Mortgage that was taken out on this home.
Original Mortgage
$65,000
Interest Rate
7.12%
Mortgage Type
Commercial
Create a Home Valuation Report for This Property
The Home Valuation Report is an in-depth analysis detailing your home's value as well as a comparison with similar homes in the area
Home Values in the Area
Average Home Value in this Area
Purchase History
| Date | Buyer | Sale Price | Title Company |
|---|---|---|---|
| Potter William F | -- | Boston National Title | |
| Potter William F | $128,000 | Chicago Title Co | |
| Burroughs Wilda M | -- | -- | |
| Bode Virgil | -- | North American Title Ins Co |
Source: Public Records
Mortgage History
| Date | Status | Borrower | Loan Amount |
|---|---|---|---|
| Previous Owner | Potter William F | $121,600 | |
| Previous Owner | Bode Virgil | $65,000 |
Source: Public Records
Tax History
| Year | Tax Paid | Tax Assessment Tax Assessment Total Assessment is a certain percentage of the fair market value that is determined by local assessors to be the total taxable value of land and additions on the property. | Land | Improvement |
|---|---|---|---|---|
| 2025 | $2,560 | $237,942 | $54,077 | $183,865 |
| 2024 | $2,513 | $233,277 | $53,017 | $180,260 |
| 2023 | $2,509 | $228,704 | $51,978 | $176,726 |
| 2022 | $2,477 | $224,220 | $50,959 | $173,261 |
| 2021 | $2,441 | $219,824 | $49,960 | $169,864 |
| 2020 | $2,424 | $217,571 | $49,448 | $168,123 |
| 2019 | $2,383 | $213,306 | $48,479 | $164,827 |
| 2018 | $2,381 | $209,125 | $47,529 | $161,596 |
| 2017 | $2,326 | $205,026 | $46,598 | $158,428 |
| 2016 | $2,172 | $201,007 | $45,685 | $155,322 |
| 2015 | $2,055 | $189,000 | $44,000 | $145,000 |
| 2014 | $1,857 | $169,000 | $44,000 | $125,000 |
Source: Public Records
Map
Nearby Homes
- 1438 Cahill Ave
- 737 E Main St
- 951 E Main St
- 1550 E Marshall St
- 861 Wayside Dr
- 411 Crane Ave
- 1598 East Ave
- 528 S Minaret Ave
- 599 S Minaret Ave
- 1227 Windsor Ct
- 494 Wayside Dr
- 311 Mitchell Ave
- 1460 E Hawkeye Ave
- 309 N Center St
- 512 N Palm St
- 401 Bothun Rd
- 411 Bothun Rd
- 1030 Alpha Rd
- 2220 El Capitan Dr
- 1740 Colorado Ave
Your Personal Tour Guide
Ask me questions while you tour the home.