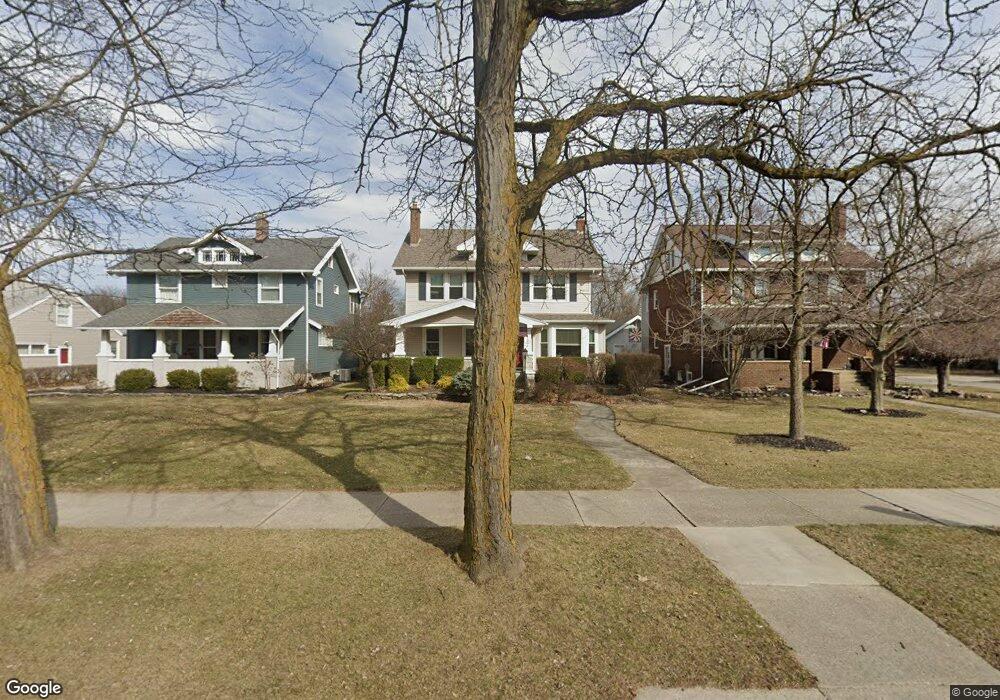
1329 S Main St Findlay, OH 45840
Estimated Value: $342,269 - $389,000
5
Beds
3
Baths
2,860
Sq Ft
$126/Sq Ft
Est. Value
About This Home
This home is located at 1329 S Main St, Findlay, OH 45840 and is currently estimated at $361,317, approximately $126 per square foot. 1329 S Main St is a home located in Hancock County with nearby schools including Jefferson Elementary School, Chamberlin Hill Elementary School, and Donnell Middle School.
Ownership History
Date
Name
Owned For
Owner Type
Purchase Details
Closed on
Feb 25, 2015
Sold by
Kreinbrink Tracy R
Bought by
Kreinbrink Brian R
Current Estimated Value
Home Financials for this Owner
Home Financials are based on the most recent Mortgage that was taken out on this home.
Original Mortgage
$255,000
Outstanding Balance
$88,724
Interest Rate
2.97%
Mortgage Type
New Conventional
Estimated Equity
$272,593
Purchase Details
Closed on
Apr 12, 1999
Sold by
Jones Thomas
Bought by
Kreinbrink Tracy
Home Financials for this Owner
Home Financials are based on the most recent Mortgage that was taken out on this home.
Original Mortgage
$133,600
Interest Rate
6.94%
Mortgage Type
New Conventional
Purchase Details
Closed on
Jun 20, 1991
Bought by
Jones Thomas E and Jones Maurie M
Purchase Details
Closed on
Mar 29, 1991
Bought by
Mitchell Howard E
Create a Home Valuation Report for This Property
The Home Valuation Report is an in-depth analysis detailing your home's value as well as a comparison with similar homes in the area
Home Values in the Area
Average Home Value in this Area
Purchase History
| Date | Buyer | Sale Price | Title Company |
|---|---|---|---|
| Kreinbrink Brian R | -- | Flag City Title | |
| Kreinbrink Tracy | $167,000 | -- | |
| Jones Thomas E | $100,000 | -- | |
| Mitchell Howard E | -- | -- |
Source: Public Records
Mortgage History
| Date | Status | Borrower | Loan Amount |
|---|---|---|---|
| Open | Kreinbrink Brian R | $255,000 | |
| Closed | Kreinbrink Tracy | $133,600 |
Source: Public Records
Tax History
| Year | Tax Paid | Tax Assessment Tax Assessment Total Assessment is a certain percentage of the fair market value that is determined by local assessors to be the total taxable value of land and additions on the property. | Land | Improvement |
|---|---|---|---|---|
| 2024 | $3,449 | $97,040 | $10,080 | $86,960 |
| 2023 | $3,454 | $97,040 | $10,080 | $86,960 |
| 2022 | $3,442 | $97,040 | $10,080 | $86,960 |
| 2021 | $3,447 | $84,630 | $10,080 | $74,550 |
| 2020 | $3,446 | $84,630 | $10,080 | $74,550 |
| 2019 | $3,377 | $84,630 | $10,080 | $74,550 |
| 2018 | $3,022 | $69,440 | $6,720 | $62,720 |
| 2017 | $1,511 | $69,440 | $6,720 | $62,720 |
| 2016 | $2,966 | $69,290 | $6,720 | $62,570 |
| 2015 | $2,895 | $66,140 | $6,720 | $59,420 |
| 2014 | $2,895 | $66,140 | $6,720 | $59,420 |
| 2012 | $2,547 | $57,810 | $6,720 | $51,090 |
Source: Public Records
Map
Nearby Homes
- 1333 S Main St
- 1321 S Main St
- 1319 S Main St
- 120 E Mcpherson Ave
- 1317 S Main St
- 1401 S Main St
- 1315 S Main St
- 119 Greenlawn Ave
- 130 E Mcpherson Ave
- 115 E Mcpherson Ave
- 123 Greenlawn Ave
- 132 E Mcpherson Ave
- 1330 S Main St
- 119 E Mcpherson Ave
- 127 Greenlawn Ave
- 1324 S Main St
- 1332 S Main St
- 1320 S Main St
- 123 E Mcpherson Ave
- 1318 S Main St
Your Personal Tour Guide
Ask me questions while you tour the home.