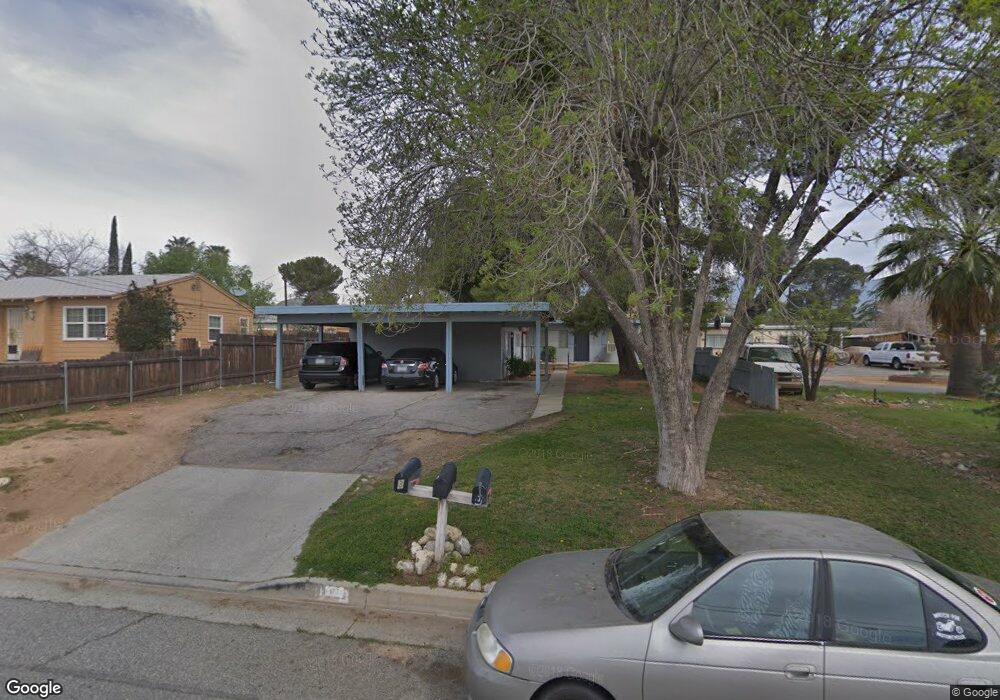
1329 W Williams St Banning, CA 92220
Estimated Value: $409,836 - $631,000
6
Beds
3
Baths
2,009
Sq Ft
$279/Sq Ft
Est. Value
About This Home
This home is located at 1329 W Williams St, Banning, CA 92220 and is currently estimated at $560,709, approximately $279 per square foot. 1329 W Williams St is a home located in Riverside County with nearby schools including Banning High School.
Ownership History
Date
Name
Owned For
Owner Type
Purchase Details
Closed on
Aug 7, 2014
Sold by
Olivan Daniel and Olivan Delena Irene
Bought by
The Olivan Family Trust
Current Estimated Value
Purchase Details
Closed on
Nov 5, 2003
Sold by
Bell Stephen and Bell Thea M
Bought by
Olivan Daniel and Olivan Delena I
Purchase Details
Closed on
Jul 12, 2000
Sold by
Bell Stephen M and Bell Thea M
Bought by
Bell Stephen and Bell Thea M
Purchase Details
Closed on
Jul 1, 1999
Sold by
Shirley Michael A and Shirley Connie L
Bought by
Bell Stephen and Bell Thea M
Home Financials for this Owner
Home Financials are based on the most recent Mortgage that was taken out on this home.
Original Mortgage
$58,400
Interest Rate
7.64%
Mortgage Type
Commercial
Purchase Details
Closed on
Jun 16, 1999
Sold by
Burrage O L
Bought by
Burrage Connie L
Home Financials for this Owner
Home Financials are based on the most recent Mortgage that was taken out on this home.
Original Mortgage
$58,400
Interest Rate
7.64%
Mortgage Type
Commercial
Create a Home Valuation Report for This Property
The Home Valuation Report is an in-depth analysis detailing your home's value as well as a comparison with similar homes in the area
Home Values in the Area
Average Home Value in this Area
Purchase History
| Date | Buyer | Sale Price | Title Company |
|---|---|---|---|
| The Olivan Family Trust | -- | None Available | |
| Olivan Daniel | $189,000 | -- | |
| Bell Stephen | -- | -- | |
| Bell Stephen | $73,000 | Gateway Title Company | |
| Burrage Connie L | -- | Gateway Title Company |
Source: Public Records
Mortgage History
| Date | Status | Borrower | Loan Amount |
|---|---|---|---|
| Previous Owner | Bell Stephen | $58,400 |
Source: Public Records
Tax History
| Year | Tax Paid | Tax Assessment Tax Assessment Total Assessment is a certain percentage of the fair market value that is determined by local assessors to be the total taxable value of land and additions on the property. | Land | Improvement |
|---|---|---|---|---|
| 2025 | $3,679 | $268,689 | $42,637 | $226,052 |
| 2023 | $3,679 | $258,257 | $40,982 | $217,275 |
| 2022 | $3,601 | $253,194 | $40,179 | $213,015 |
| 2021 | $3,532 | $248,231 | $39,392 | $208,839 |
| 2020 | $3,501 | $245,687 | $38,989 | $206,698 |
| 2019 | $3,447 | $240,871 | $38,225 | $202,646 |
| 2018 | $3,425 | $236,149 | $37,477 | $198,672 |
| 2017 | $3,369 | $231,520 | $36,743 | $194,777 |
| 2016 | $2,622 | $185,000 | $35,000 | $150,000 |
| 2015 | $2,207 | $155,000 | $30,000 | $125,000 |
| 2014 | $2,024 | $140,000 | $25,000 | $115,000 |
Source: Public Records
Map
Nearby Homes
- 266 N 14th St
- 1137 W Williams St
- 1117 W Hays St
- 1174 W Hays St
- 979 W Nicolet St
- 1645 W Hays St
- 831 W George St
- 711 N 16th St
- 640 W Nicolet St
- 437 W Ramsey St
- 1078 W King St
- 182 N 4th St
- 1193 W King St
- 57 S 3rd St
- 2200 W Wilson St Unit 54
- 2200 W Wilson St Unit 82
- 2200 W Wilson St Unit 154
- 2200 W Wilson St Unit 69
- 2200 W Wilson St
- 2200 W Wilson St Unit 122
- 1351 W Williams St
- 1309 W Williams St
- 1365 W Williams St
- 1301 W Williams St
- 1279 W Williams St
- 1385 W Williams St
- 248 N 14th St
- 286 N 14th St
- 1241 W Williams St
- 1419 W Williams St
- 342 N 14th St
- 1418 W Jacinto View Rd
- 267 N 12th St
- 1414 W Williams St
- 273 N 12th St
- 1430 W Williams St
- 1221 W Williams St
- 1439 W Williams St
- 1338 W Nicolet St
- 289 N 12th St
Your Personal Tour Guide
Ask me questions while you tour the home.