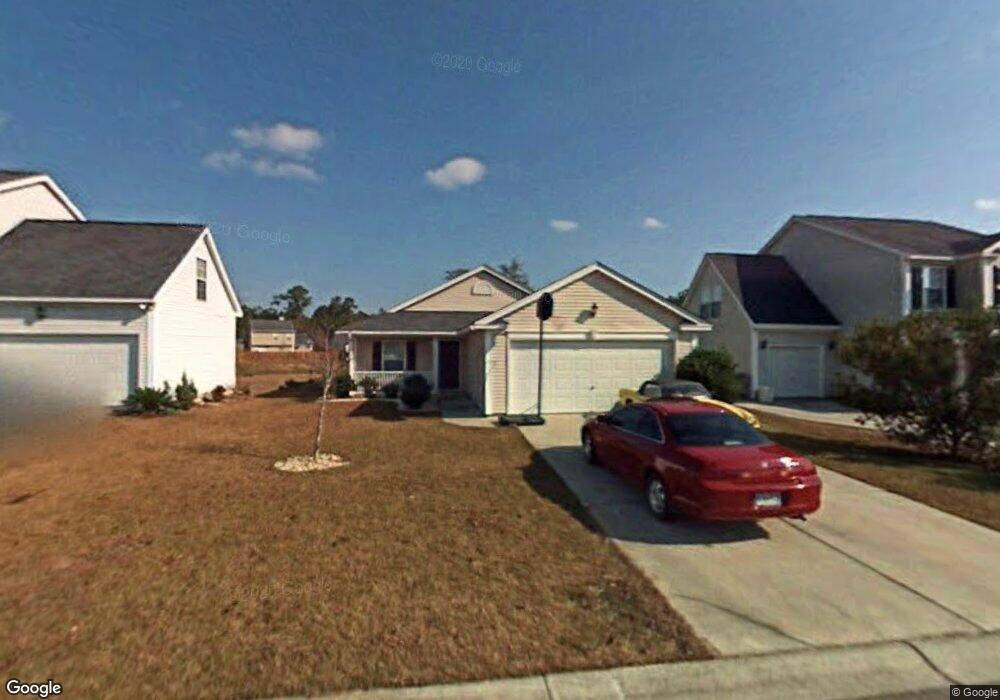
133 2 Pond Loop Ladson, SC 29456
Estimated Value: $274,000 - $330,000
3
Beds
2
Baths
1,410
Sq Ft
$214/Sq Ft
Est. Value
About This Home
This home is located at 133 2 Pond Loop, Ladson, SC 29456 and is currently estimated at $302,316, approximately $214 per square foot. 133 2 Pond Loop is a home located in Dorchester County with nearby schools including Joseph R. Pye Elementary, Oakbrook Middle School, and Ashley Ridge High School.
Ownership History
Date
Name
Owned For
Owner Type
Purchase Details
Closed on
Oct 20, 2023
Sold by
Lochtefeld David R and Lochtefeld Kimie L
Bought by
Gonzalez Joshua
Current Estimated Value
Home Financials for this Owner
Home Financials are based on the most recent Mortgage that was taken out on this home.
Original Mortgage
$300,626
Outstanding Balance
$289,822
Interest Rate
4%
Mortgage Type
VA
Estimated Equity
$12,494
Purchase Details
Closed on
Jul 23, 2003
Sold by
Humphries Cary and Rogers Suzanne Marie
Bought by
Lochtefeld David R and Lochtefeld Kimie L
Purchase Details
Closed on
May 31, 2000
Sold by
Beazer Homes Corp
Bought by
Humphries Cary and Rogers Suzanne Marie
Purchase Details
Closed on
Feb 1, 2000
Sold by
Akj Investments Llc
Bought by
Beazer Homes Corp
Create a Home Valuation Report for This Property
The Home Valuation Report is an in-depth analysis detailing your home's value as well as a comparison with similar homes in the area
Home Values in the Area
Average Home Value in this Area
Purchase History
| Date | Buyer | Sale Price | Title Company |
|---|---|---|---|
| Gonzalez Joshua | $294,299 | None Listed On Document | |
| Lochtefeld David R | $126,000 | -- | |
| Humphries Cary | $112,960 | -- | |
| Beazer Homes Corp | $159,700 | -- |
Source: Public Records
Mortgage History
| Date | Status | Borrower | Loan Amount |
|---|---|---|---|
| Open | Gonzalez Joshua | $300,626 |
Source: Public Records
Tax History
| Year | Tax Paid | Tax Assessment Tax Assessment Total Assessment is a certain percentage of the fair market value that is determined by local assessors to be the total taxable value of land and additions on the property. | Land | Improvement |
|---|---|---|---|---|
| 2025 | $7,516 | $17,646 | $6,840 | $10,806 |
| 2024 | $7,382 | $17,646 | $6,840 | $10,806 |
| 2023 | $7,382 | $10,854 | $2,400 | $8,454 |
| 2022 | $4,145 | $9,770 | $2,070 | $7,700 |
| 2021 | $4,227 | $9,770 | $2,070 | $7,700 |
| 2020 | $4,068 | $8,490 | $1,800 | $6,690 |
| 2019 | $4,015 | $8,490 | $1,800 | $6,690 |
| 2018 | $3,446 | $8,490 | $1,800 | $6,690 |
| 2017 | $3,408 | $8,490 | $1,800 | $6,690 |
| 2016 | $3,360 | $8,490 | $1,800 | $6,690 |
| 2015 | $3,363 | $8,490 | $1,800 | $6,690 |
| 2014 | $3,362 | $143,520 | $0 | $0 |
| 2013 | -- | $8,610 | $0 | $0 |
Source: Public Records
Map
Nearby Homes
- 120 Two Pond Loop
- 206 Limehouse Dr
- 202 Elliott Dr
- 9631 Crosscut Dr
- 224 Withers Ln
- 218 Withers Ln
- 9875 Jamison Rd
- 9658 Jamison Rd
- 201 Ibis Dr
- 203 Ibis Dr
- 208 Terrace View Dr
- 217 Beverly Dr
- 1001 Margaret Dr
- 203 Terrace View Dr
- 3857 Annapolis Way
- 117 Alwyn Blvd
- 101 Wood Side Dr
- 293 Chemistry Cir
- 111 Jarett Rd
- 278 Chemistry Cir
- 133 Two Pond Loop
- 135 Two Pond Loop
- 131 Two Pond Loop
- 139 Two Pond Loop
- 127 Two Pond Loop
- 134 Two Pond Loop
- 161 Two Pond Loop
- 132 Two Pond Loop
- 163 Two Pond Loop
- 136 Two Pond Loop
- 121 Two Pond Loop
- 157 Two Pond Loop
- 130 Two Pond Loop
- 165 Two Pond Loop
- 138 Two Pond Loop
- 138 2 Pond Loop
- 153 Two Pond Loop
- 119 Two Pond Loop
- 128 Two Pond Loop
- 167 Two Pond Loop
Your Personal Tour Guide
Ask me questions while you tour the home.