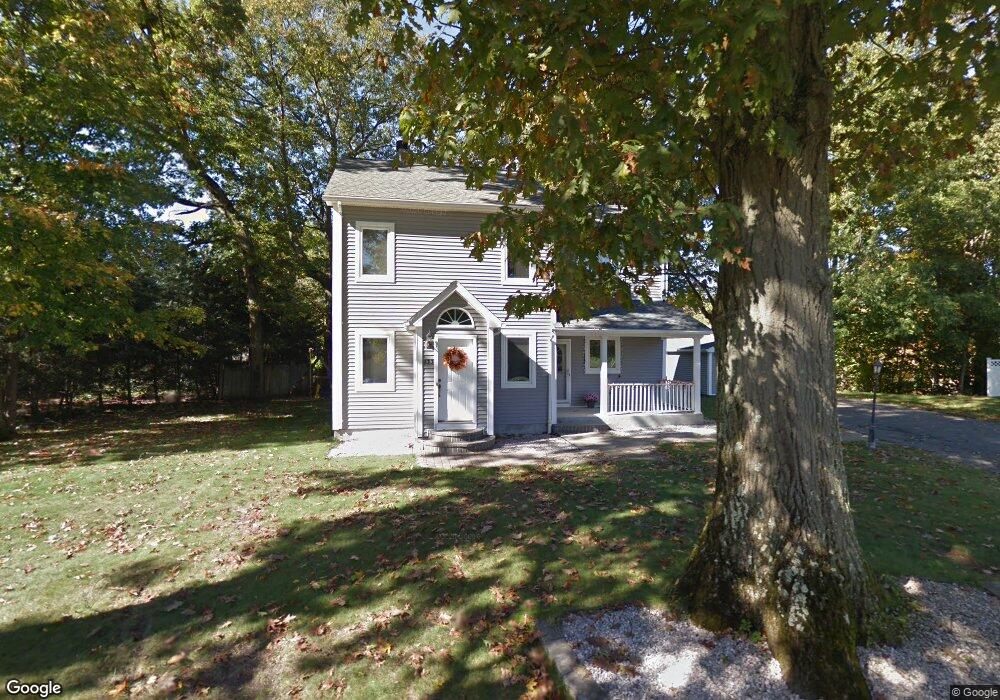
133 Alfred St Ludlow, MA 01056
Estimated Value: $379,018 - $461,000
3
Beds
2
Baths
1,756
Sq Ft
$237/Sq Ft
Est. Value
About This Home
This home is located at 133 Alfred St, Ludlow, MA 01056 and is currently estimated at $416,755, approximately $237 per square foot. 133 Alfred St is a home located in Hampden County with nearby schools including East Street Elementary School, Chapin Street Elementary School, and Paul R. Baird Middle School.
Ownership History
Date
Name
Owned For
Owner Type
Purchase Details
Closed on
Jul 14, 2011
Sold by
Friese Richard P and Friese Sarah J
Bought by
Stevenson Anthony J and Stevenson Brittany A
Current Estimated Value
Home Financials for this Owner
Home Financials are based on the most recent Mortgage that was taken out on this home.
Original Mortgage
$275,702
Outstanding Balance
$188,930
Interest Rate
4.58%
Mortgage Type
Purchase Money Mortgage
Estimated Equity
$227,825
Purchase Details
Closed on
Mar 3, 2004
Sold by
Martins Paul J and Martins Tania M
Bought by
Friese Richard P and Bishop Sarah J
Home Financials for this Owner
Home Financials are based on the most recent Mortgage that was taken out on this home.
Original Mortgage
$220,000
Interest Rate
5.62%
Mortgage Type
Purchase Money Mortgage
Purchase Details
Closed on
Jan 8, 2001
Sold by
Taylor Mary E
Bought by
Enxuto Tania M
Create a Home Valuation Report for This Property
The Home Valuation Report is an in-depth analysis detailing your home's value as well as a comparison with similar homes in the area
Home Values in the Area
Average Home Value in this Area
Purchase History
| Date | Buyer | Sale Price | Title Company |
|---|---|---|---|
| Stevenson Anthony J | $269,900 | -- | |
| Stevenson Anthony J | $269,900 | -- | |
| Friese Richard P | $250,000 | -- | |
| Friese Richard P | $250,000 | -- | |
| Enxuto Tania M | $85,000 | -- | |
| Enxuto Tania M | $85,000 | -- |
Source: Public Records
Mortgage History
| Date | Status | Borrower | Loan Amount |
|---|---|---|---|
| Open | Stevenson Anthony J | $275,702 | |
| Closed | Enxuto Tania M | $275,702 | |
| Previous Owner | Friese Richard P | $220,000 |
Source: Public Records
Tax History
| Year | Tax Paid | Tax Assessment Tax Assessment Total Assessment is a certain percentage of the fair market value that is determined by local assessors to be the total taxable value of land and additions on the property. | Land | Improvement |
|---|---|---|---|---|
| 2025 | $5,769 | $332,500 | $95,000 | $237,500 |
| 2024 | $5,608 | $310,000 | $96,500 | $213,500 |
| 2023 | $5,492 | $281,500 | $88,300 | $193,200 |
| 2022 | $4,934 | $246,800 | $81,000 | $165,800 |
| 2021 | $4,950 | $234,800 | $81,000 | $153,800 |
| 2020 | $4,738 | $229,800 | $79,700 | $150,100 |
| 2019 | $4,452 | $224,600 | $79,000 | $145,600 |
| 2018 | $4,173 | $219,500 | $79,000 | $140,500 |
| 2017 | $4,014 | $216,600 | $77,400 | $139,200 |
| 2016 | $3,932 | $216,900 | $75,900 | $141,000 |
| 2015 | $3,688 | $213,300 | $75,100 | $138,200 |
Source: Public Records
Map
Nearby Homes
- 382 Holyoke St
- 47 Kendall St
- 482 Holyoke St
- 350 West St Unit 3
- 350 West St Unit 19
- 350 West St Unit 17
- Lot 602 Grandview Ave
- 420 West St
- 15 Hilltop Terrace
- 57 Belmont St
- 42 Roy St
- 119 Blisswood Village Dr
- 98 Fuller St Unit 32
- 102 Swan Ave
- 70 Fuller St
- 0 Fuller St Unit 73409741
- 26 Swan Ave
- 12 Mariana Ln
- 350 West Ave Unit 5
- 84 Chapin Greene Dr
Your Personal Tour Guide
Ask me questions while you tour the home.