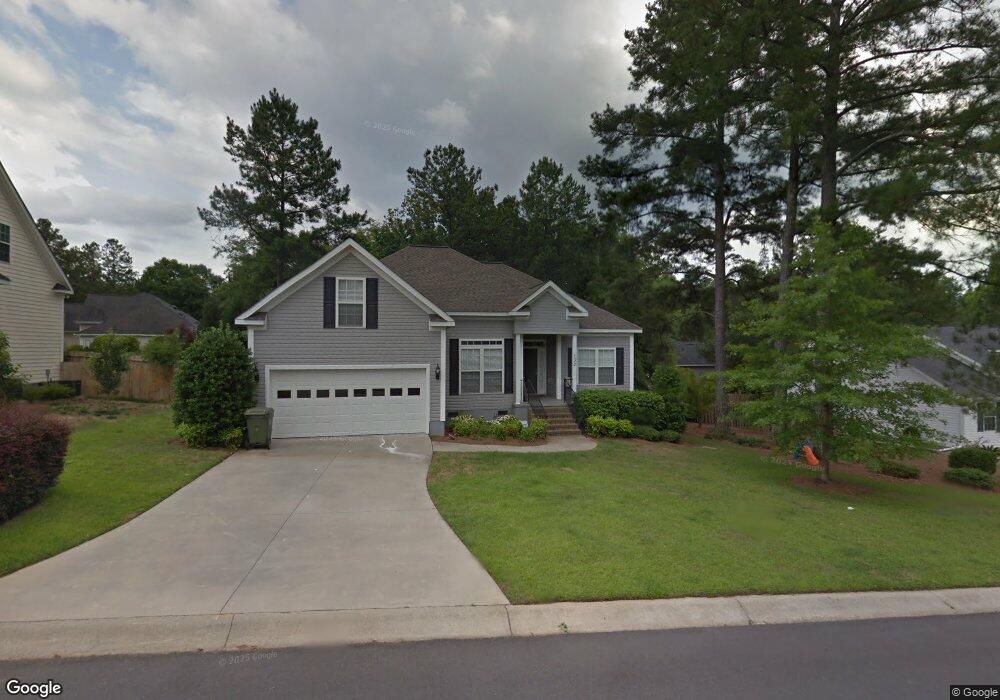
133 Ashepoo Dr Aiken, SC 29803
Woodside NeighborhoodEstimated Value: $347,294 - $387,000
3
Beds
2
Baths
2,180
Sq Ft
$164/Sq Ft
Est. Value
About This Home
This home is located at 133 Ashepoo Dr, Aiken, SC 29803 and is currently estimated at $358,574, approximately $164 per square foot. 133 Ashepoo Dr is a home located in Aiken County with nearby schools including Chukker Creek Elementary School, M.B. Kennedy Middle School, and Aiken Intermediate School.
Ownership History
Date
Name
Owned For
Owner Type
Purchase Details
Closed on
Aug 18, 2014
Sold by
Blanton Lori L
Bought by
Blanton Charles W
Current Estimated Value
Purchase Details
Closed on
Jun 30, 2010
Sold by
Smith Walter Terry and Smith Elna Jeanette
Bought by
Blanton Charles W and Blanton Lori L
Home Financials for this Owner
Home Financials are based on the most recent Mortgage that was taken out on this home.
Original Mortgage
$206,910
Outstanding Balance
$138,248
Interest Rate
4.83%
Mortgage Type
New Conventional
Estimated Equity
$220,326
Purchase Details
Closed on
Jun 30, 2005
Sold by
R S Girardeau Co Inc
Bought by
Smith Walter Terry and Smith Elna Jeanette
Purchase Details
Closed on
Dec 5, 2003
Sold by
Plantation South Development Co Llc
Bought by
R S Girardeau Co Inc
Create a Home Valuation Report for This Property
The Home Valuation Report is an in-depth analysis detailing your home's value as well as a comparison with similar homes in the area
Home Values in the Area
Average Home Value in this Area
Purchase History
| Date | Buyer | Sale Price | Title Company |
|---|---|---|---|
| Blanton Charles W | -- | -- | |
| Blanton Charles W | $229,900 | -- | |
| Smith Walter Terry | $189,000 | -- | |
| R S Girardeau Co Inc | $20,700 | -- |
Source: Public Records
Mortgage History
| Date | Status | Borrower | Loan Amount |
|---|---|---|---|
| Open | Blanton Charles W | $206,910 |
Source: Public Records
Tax History Compared to Growth
Tax History
| Year | Tax Paid | Tax Assessment Tax Assessment Total Assessment is a certain percentage of the fair market value that is determined by local assessors to be the total taxable value of land and additions on the property. | Land | Improvement |
|---|---|---|---|---|
| 2023 | $863 | $8,600 | $1,080 | $187,910 |
| 2022 | $839 | $8,600 | $0 | $0 |
| 2021 | $841 | $8,600 | $0 | $0 |
| 2020 | $776 | $7,820 | $0 | $0 |
| 2019 | $776 | $7,820 | $0 | $0 |
| 2018 | $485 | $7,820 | $970 | $6,850 |
| 2017 | $738 | $0 | $0 | $0 |
| 2016 | $739 | $0 | $0 | $0 |
| 2015 | $866 | $0 | $0 | $0 |
| 2014 | $867 | $0 | $0 | $0 |
| 2013 | -- | $0 | $0 | $0 |
Source: Public Records
Map
Nearby Homes
- 213 Birch Tree Cir
- Lot 2 River Birch Rd
- 102 White Birch Ct
- 230 Birch Tree Cir
- 227 Birch Tree Cir
- 106 Holley Ridge Rd
- 135 Trippi Ln
- 115 Buckhar Ln
- 212 Buckhar Ln
- 158 Hodges Bay Dr
- 127 Whitecap Place
- 2393 Chukker Creek Rd
- 129 E Pleasant Colony Dr
- 582 Equinox Loop
- 375 Forest Pines Rd
- 109 Poplar Hill Ct
- 149 Equinox Loop
- 157 Equinox Loop
- 165 Equinox Loop
- 245 Hodges Bay Dr