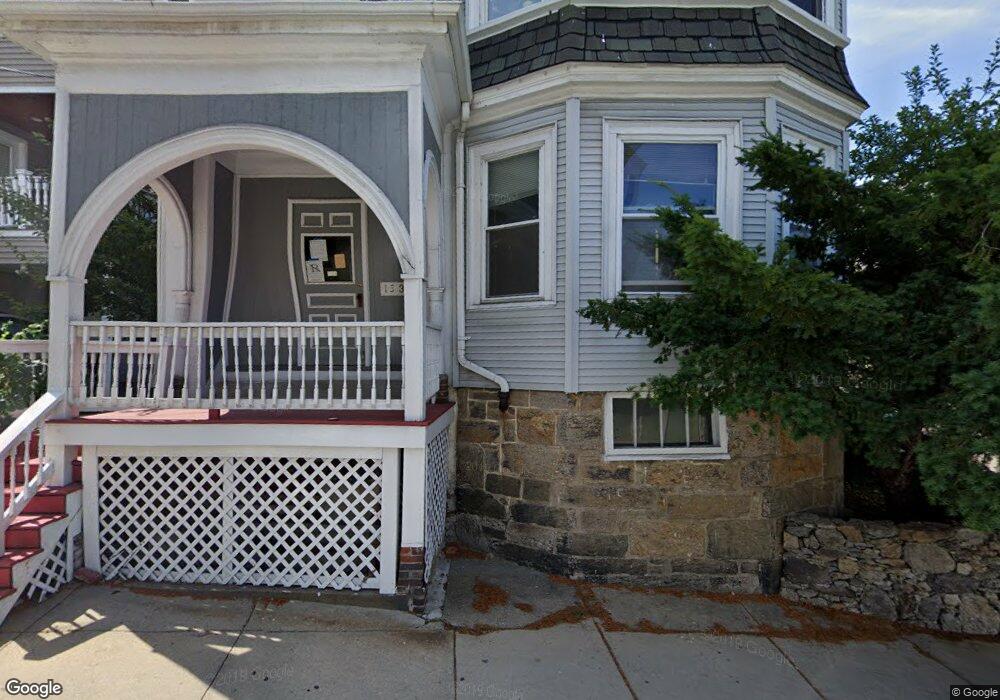
133 Calumet St Unit 4 Roxbury Crossing, MA 02120
Mission Hill NeighborhoodEstimated Value: $504,000 - $675,567
2
Beds
2
Baths
1,148
Sq Ft
$522/Sq Ft
Est. Value
About This Home
This home is located at 133 Calumet St Unit 4, Roxbury Crossing, MA 02120 and is currently estimated at $599,142, approximately $521 per square foot. 133 Calumet St Unit 4 is a home located in Suffolk County with nearby schools including Roxbury Preparatory Charter School, Malik Academy, and Manville School.
Ownership History
Date
Name
Owned For
Owner Type
Purchase Details
Closed on
Jan 15, 2014
Sold by
Lippe Anne and Phipps Colin S
Bought by
Phipps Boston 4 Llc
Current Estimated Value
Purchase Details
Closed on
Jun 15, 2004
Sold by
Vonkries F Roger
Bought by
Lippe Anne and Phipps Colin S
Purchase Details
Closed on
Aug 1, 2000
Sold by
Vonkries Beverly
Bought by
Vonkries F Roger
Home Financials for this Owner
Home Financials are based on the most recent Mortgage that was taken out on this home.
Original Mortgage
$119,700
Interest Rate
8.18%
Mortgage Type
Purchase Money Mortgage
Purchase Details
Closed on
Sep 22, 1999
Sold by
Berger Aaron
Bought by
Vonkries Beverly
Home Financials for this Owner
Home Financials are based on the most recent Mortgage that was taken out on this home.
Original Mortgage
$113,400
Interest Rate
8.1%
Mortgage Type
Purchase Money Mortgage
Purchase Details
Closed on
Jul 18, 1997
Sold by
Romano Janet A
Bought by
Berger Aaron
Home Financials for this Owner
Home Financials are based on the most recent Mortgage that was taken out on this home.
Original Mortgage
$65,000
Interest Rate
7.79%
Mortgage Type
Purchase Money Mortgage
Create a Home Valuation Report for This Property
The Home Valuation Report is an in-depth analysis detailing your home's value as well as a comparison with similar homes in the area
Home Values in the Area
Average Home Value in this Area
Purchase History
| Date | Buyer | Sale Price | Title Company |
|---|---|---|---|
| Phipps Boston 4 Llc | -- | -- | |
| Lippe Anne | $225,000 | -- | |
| Vonkries F Roger | $126,000 | -- | |
| Vonkries Beverly | $126,000 | -- | |
| Berger Aaron | $67,000 | -- |
Source: Public Records
Mortgage History
| Date | Status | Borrower | Loan Amount |
|---|---|---|---|
| Previous Owner | Berger Aaron | $119,700 | |
| Previous Owner | Berger Aaron | $113,400 | |
| Previous Owner | Berger Aaron | $65,000 |
Source: Public Records
Tax History Compared to Growth
Tax History
| Year | Tax Paid | Tax Assessment Tax Assessment Total Assessment is a certain percentage of the fair market value that is determined by local assessors to be the total taxable value of land and additions on the property. | Land | Improvement |
|---|---|---|---|---|
| 2025 | $6,524 | $563,400 | $0 | $563,400 |
| 2024 | $6,104 | $560,000 | $0 | $560,000 |
| 2023 | $5,837 | $543,500 | $0 | $543,500 |
| 2022 | $5,631 | $517,600 | $0 | $517,600 |
| 2021 | $5,523 | $517,600 | $0 | $517,600 |
| 2020 | $5,183 | $490,800 | $0 | $490,800 |
| 2019 | $4,789 | $454,400 | $0 | $454,400 |
| 2018 | $4,411 | $420,900 | $0 | $420,900 |
| 2017 | $4,165 | $393,300 | $0 | $393,300 |
| 2016 | $4,005 | $364,100 | $0 | $364,100 |
| 2015 | $3,583 | $295,900 | $0 | $295,900 |
| 2014 | $3,412 | $271,200 | $0 | $271,200 |
Source: Public Records
Map
Nearby Homes
- 97 Hillside St
- 91-93 Calumet St
- 7 Oswald St
- 143 Hillside St
- 22 Fisher Ave
- 18 Eldora St
- 743 Parker St Unit 3
- 92 Lawn St Unit 7-160
- 100 Lawn St Unit 100
- 820-824 Huntington Ave
- 130 Minden St
- 50 Jamaicaway Unit 1
- 11 Gay Head St
- 390 Riverway Unit 24
- 59 Fort Ave
- 70 Day St Unit 2
- 70 Day St
- 70 Day St Unit 1
- 3 Kenney St Unit 2
- 249 Roxbury St Unit 1
- 133 Calumet St Unit 3
- 133 Calumet St Unit 2
- 133 Calumet St Unit 1
- 133 Calumet St
- 135 Calumet St Unit 3
- 135 Calumet St Unit 2
- 135 Calumet St Unit 1
- 94 Hillside St
- 94 Hillside St Unit 94 Hillside St
- 94 Hillside St Unit Hillside St
- 94 Hillside St Unit 94 Hillside St 1
- 94 Hillside St Unit 3
- 94 Hillside St Unit 2
- 94 Hillside St Unit 1
- 94 Hillside St
- 94 Hillside St Unit 3
- 94 Hillside St Unit 1
- 137 Calumet St
- 137 Calumet St Unit 3
- 137 Calumet St Unit 2