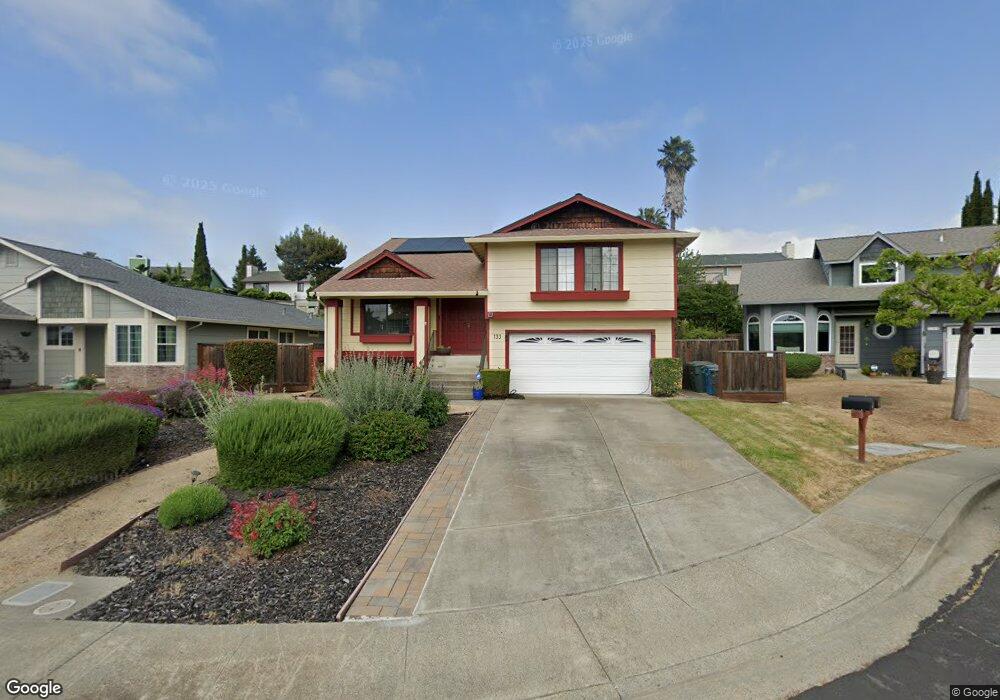
133 Captains Ct Vallejo, CA 94591
Glen Cove NeighborhoodEstimated Value: $714,449 - $840,000
4
Beds
3
Baths
2,539
Sq Ft
$301/Sq Ft
Est. Value
About This Home
This home is located at 133 Captains Ct, Vallejo, CA 94591 and is currently estimated at $763,112, approximately $300 per square foot. 133 Captains Ct is a home located in Solano County with nearby schools including Glen Cove Elementary, Jesse M. Bethel High School, and Vallejo Charter School.
Ownership History
Date
Name
Owned For
Owner Type
Purchase Details
Closed on
Sep 9, 2015
Sold by
Bartley Cody and Bartley Niesa
Bought by
Rodgers Eliott Jonathon and Ryle Janine Denise
Current Estimated Value
Home Financials for this Owner
Home Financials are based on the most recent Mortgage that was taken out on this home.
Original Mortgage
$352,000
Outstanding Balance
$276,473
Interest Rate
3.91%
Mortgage Type
New Conventional
Estimated Equity
$486,639
Purchase Details
Closed on
Aug 15, 2012
Sold by
Federal National Mortgage Association
Bought by
Bartley Cody and Bartley Niesa
Home Financials for this Owner
Home Financials are based on the most recent Mortgage that was taken out on this home.
Original Mortgage
$272,968
Interest Rate
4.25%
Mortgage Type
FHA
Purchase Details
Closed on
Jun 11, 2012
Sold by
Jpmorgan Chase Bank National Association
Bought by
Federal National Mortgage Association
Purchase Details
Closed on
May 10, 2012
Sold by
Dizon Manuelito G and Dizon Elvira A
Bought by
Jpmorgan Chase Bank National Association
Create a Home Valuation Report for This Property
The Home Valuation Report is an in-depth analysis detailing your home's value as well as a comparison with similar homes in the area
Home Values in the Area
Average Home Value in this Area
Purchase History
| Date | Buyer | Sale Price | Title Company |
|---|---|---|---|
| Rodgers Eliott Jonathon | $440,000 | Old Republic Title Company | |
| Bartley Cody | $247,000 | First American Title Company | |
| Federal National Mortgage Association | -- | None Available | |
| Jpmorgan Chase Bank National Association | $320,877 | None Available |
Source: Public Records
Mortgage History
| Date | Status | Borrower | Loan Amount |
|---|---|---|---|
| Open | Rodgers Eliott Jonathon | $352,000 | |
| Previous Owner | Bartley Cody | $272,968 |
Source: Public Records
Tax History
| Year | Tax Paid | Tax Assessment Tax Assessment Total Assessment is a certain percentage of the fair market value that is determined by local assessors to be the total taxable value of land and additions on the property. | Land | Improvement |
|---|---|---|---|---|
| 2025 | $7,203 | $520,863 | $130,213 | $390,650 |
| 2024 | $7,203 | $510,651 | $127,660 | $382,991 |
| 2023 | $6,851 | $500,639 | $125,157 | $375,482 |
| 2022 | $6,771 | $490,823 | $122,704 | $368,119 |
| 2021 | $6,625 | $481,200 | $120,299 | $360,901 |
| 2020 | $6,677 | $476,267 | $119,066 | $357,201 |
| 2019 | $6,505 | $466,930 | $116,732 | $350,198 |
| 2018 | $6,119 | $457,776 | $114,444 | $343,332 |
| 2017 | $5,879 | $448,800 | $112,200 | $336,600 |
| 2016 | $5,310 | $440,000 | $110,000 | $330,000 |
| 2015 | $3,186 | $253,079 | $76,846 | $176,233 |
| 2014 | $3,045 | $248,122 | $75,341 | $172,781 |
Source: Public Records
Map
Nearby Homes
- 181 Crowsnest Ct
- 1000 Topsail Dr
- 171 Ancheta Place
- 449 Topsail Dr
- 180 Winter Harbor Place
- 133 Windsurfer Ct
- 117 Shoal Dr W
- 154 Camino Del Sol
- 7 Cliff Walk Dr
- 900 Cambridge Dr Unit 3
- 900 Cambridge Dr Unit 122
- 900 Cambridge Dr Unit 95
- 900 Cambridge Dr Unit 114
- 900 Cambridge Dr Unit 104
- 100 Bear Cove Ct
- 621 New Bedford Dr
- 199 Mariner Dr
- 211 Salt Point Ct Unit 8
- 1259 Fulton Ave
- 511 Timbercove St Unit 8
Your Personal Tour Guide
Ask me questions while you tour the home.