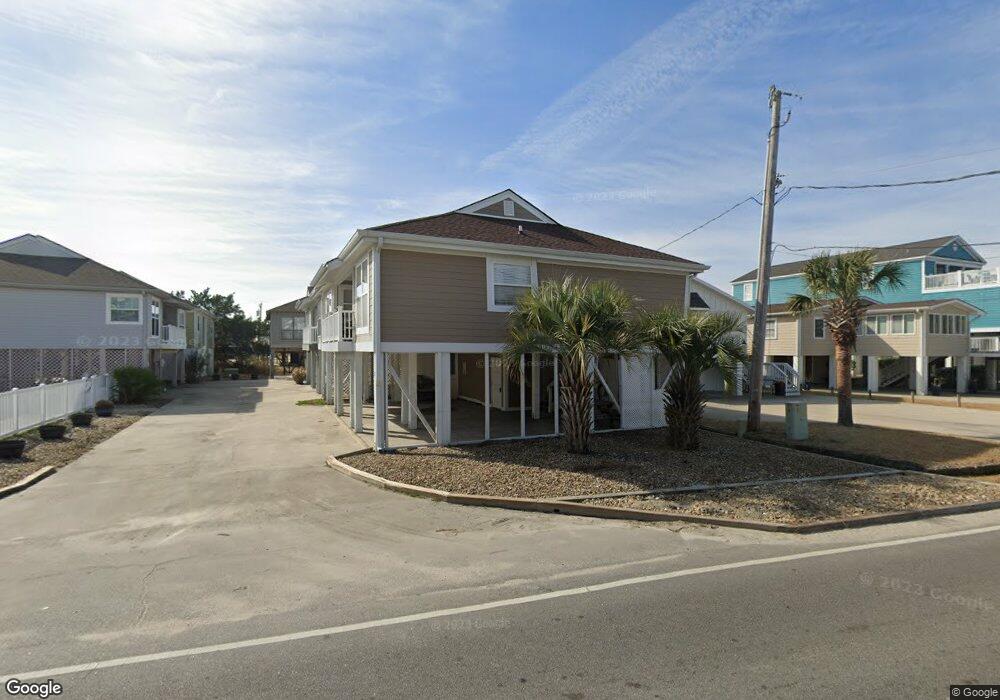
133 Cypress Ave Unit A Murrells Inlet, SC 29576
Estimated Value: $142,000 - $345,000
2
Beds
2
Baths
911
Sq Ft
$268/Sq Ft
Est. Value
About This Home
This home is located at 133 Cypress Ave Unit A, Murrells Inlet, SC 29576 and is currently estimated at $244,209, approximately $268 per square foot. 133 Cypress Ave Unit A is a home located in Horry County with nearby schools including Seaside Elementary, St. James Middle School, and St. James Intermediate.
Ownership History
Date
Name
Owned For
Owner Type
Purchase Details
Closed on
Dec 15, 2021
Sold by
Jones Allen D
Bought by
Burnside Gloria S and Burnside Barney
Current Estimated Value
Purchase Details
Closed on
Aug 1, 2008
Sold by
Spangler Richard H
Bought by
Jones Allen D
Purchase Details
Closed on
Mar 2, 2006
Sold by
Ballington Laurel F
Bought by
Burnside Barney and Burnside Gloria S
Home Financials for this Owner
Home Financials are based on the most recent Mortgage that was taken out on this home.
Original Mortgage
$137,500
Interest Rate
6.19%
Mortgage Type
Fannie Mae Freddie Mac
Purchase Details
Closed on
May 12, 2003
Sold by
Prosser Lavonne H and Lee Rita H
Bought by
Burnside Barney and Burnside Gloria S
Home Financials for this Owner
Home Financials are based on the most recent Mortgage that was taken out on this home.
Original Mortgage
$150,000
Interest Rate
5.81%
Mortgage Type
Purchase Money Mortgage
Create a Home Valuation Report for This Property
The Home Valuation Report is an in-depth analysis detailing your home's value as well as a comparison with similar homes in the area
Home Values in the Area
Average Home Value in this Area
Purchase History
| Date | Buyer | Sale Price | Title Company |
|---|---|---|---|
| Burnside Gloria S | $112,500 | -- | |
| Jones Allen D | $106,000 | -- | |
| Burnside Barney | $105,000 | None Available | |
| Burnside Barney | $187,500 | -- |
Source: Public Records
Mortgage History
| Date | Status | Borrower | Loan Amount |
|---|---|---|---|
| Previous Owner | Burnside Barney | $137,500 | |
| Previous Owner | Burnside Barney | $150,000 |
Source: Public Records
Tax History Compared to Growth
Tax History
| Year | Tax Paid | Tax Assessment Tax Assessment Total Assessment is a certain percentage of the fair market value that is determined by local assessors to be the total taxable value of land and additions on the property. | Land | Improvement |
|---|---|---|---|---|
| 2024 | $4,609 | $21,804 | $0 | $21,804 |
| 2023 | $4,609 | $25,725 | $0 | $25,725 |
| 2021 | $3,394 | $25,725 | $0 | $25,725 |
| 2020 | $2,784 | $25,725 | $0 | $25,725 |
| 2019 | $2,784 | $25,725 | $0 | $25,725 |
| 2018 | $0 | $21,000 | $0 | $21,000 |
| 2017 | $2,495 | $12,000 | $0 | $12,000 |
| 2016 | -- | $12,000 | $0 | $12,000 |
| 2015 | $2,495 | $21,000 | $0 | $21,000 |
| 2014 | $2,361 | $12,000 | $0 | $12,000 |
Source: Public Records
Map
Nearby Homes
- 131 Cypress Ave
- 163 Cypress Ave Unit Marlins & Mermaids
- 601 N Waccamaw Dr Unit s A&B
- 154 Cypress Ave
- 625 N Waccamaw Dr Unit 107
- 618 N Waccamaw Dr Unit B7
- 618 N Waccamaw Dr Unit A-5
- 618 N Waccamaw Dr Unit A-2
- 125 Easy St
- 161 Easy St
- 720 N Waccamaw Dr Unit 301 Beach House
- 340 N Waccamaw Dr Unit 201
- 147 Anglers Dr Unit SUMMER HOUSE
- 320 N Waccamaw Dr Unit 3B
- 807 N Waccamaw Dr
- 815 N Waccamaw Dr Unit 8
- 301 N Waccamaw Dr Unit 108 Garden Sands
- 301 N Waccamaw Dr Unit 205
- 301 N Waccamaw Dr Unit 211 GARDEN SANDS
- 301 N Waccamaw Dr Unit 110
- 131B Cypress Ave
- 127D Cypress Ave
- 127 Cypress Ave
- 143 Cypress Ave
- 135 Cypress Ave
- 125 Cypress Ave Unit E1
- 125 Cypress Ave Unit 125-E Cypress Place
- 129C Cypress Ave
- 129C Cypress Ave Unit Cypress Place
- 141 Cypress Ave
- 119 Cypress Ave Unit H1
- 123 Cypress Ave Unit Cypress Place
- 123 Cypress Ave Unit F1
- 121 Cypress Ave Unit G1
- 138 Cypress Ave
- 119 Cypress Ave Unit 119 H Cypress Drive
- 163 Cypress Ave Unit GC
- 163 Cypress Ave Unit Tequila Sunrise
- 134 Cypress Ave
- 132 Cypress Ave