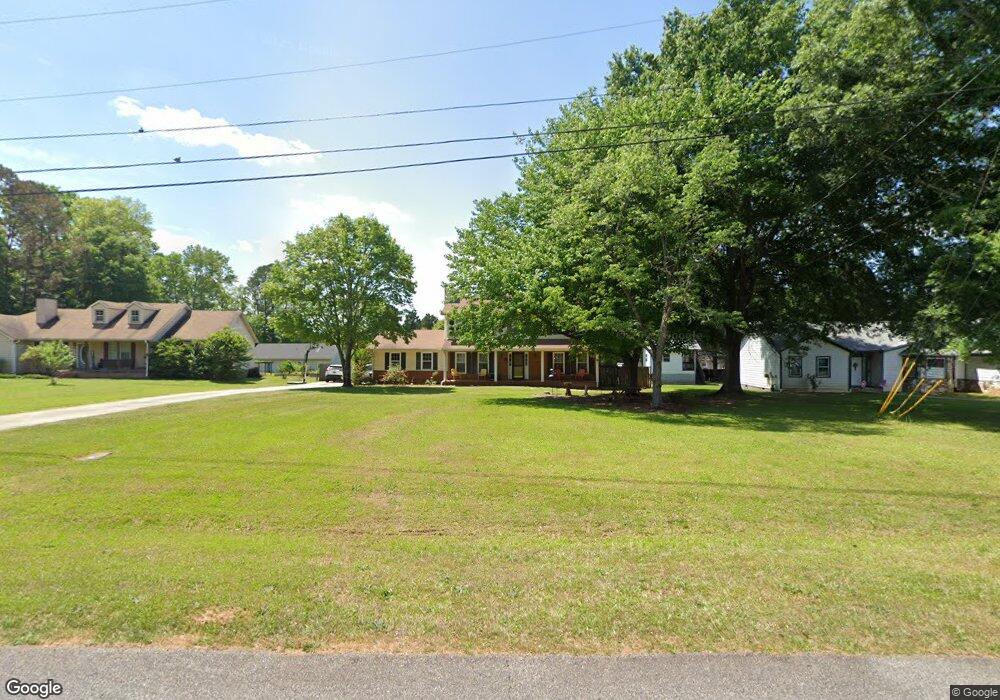
133 Davidson Cir Griffin, GA 30223
Spalding County NeighborhoodEstimated Value: $252,000 - $271,000
4
Beds
3
Baths
1,824
Sq Ft
$142/Sq Ft
Est. Value
About This Home
This home is located at 133 Davidson Cir, Griffin, GA 30223 and is currently estimated at $258,684, approximately $141 per square foot. 133 Davidson Cir is a home located in Spalding County with nearby schools including Cowan Road Elementary School, Cowan Road Middle School, and Griffin High School.
Ownership History
Date
Name
Owned For
Owner Type
Purchase Details
Closed on
Dec 7, 2004
Sold by
Cook Tony
Bought by
Mers Inc
Current Estimated Value
Purchase Details
Closed on
Feb 10, 1999
Sold by
Fowler Raymond C and Johanna K
Bought by
Cook Tony
Home Financials for this Owner
Home Financials are based on the most recent Mortgage that was taken out on this home.
Original Mortgage
$90,909
Interest Rate
6.85%
Mortgage Type
New Conventional
Purchase Details
Closed on
Jul 27, 1995
Sold by
Webb Jack D
Bought by
Fowler Raymond C and Fowler Johanna K
Purchase Details
Closed on
Dec 15, 1992
Sold by
Webb Dianne J
Bought by
Webb Jack D
Purchase Details
Closed on
Nov 20, 1992
Sold by
Conner Lamar and Conner Juanita J
Bought by
Webb Jack D and Webb Dianne J
Purchase Details
Closed on
Jun 23, 1989
Sold by
Vining James
Bought by
Conner Lamar and Conner Juanita J
Purchase Details
Closed on
Mar 31, 1988
Sold by
Davidson Ted and Davidson Tom
Bought by
Vining James
Create a Home Valuation Report for This Property
The Home Valuation Report is an in-depth analysis detailing your home's value as well as a comparison with similar homes in the area
Home Values in the Area
Average Home Value in this Area
Purchase History
| Date | Buyer | Sale Price | Title Company |
|---|---|---|---|
| Mers Inc | $100,510 | -- | |
| Cook Tony | $93,600 | -- | |
| Fowler Raymond C | $82,500 | -- | |
| Webb Jack D | -- | -- | |
| Webb Jack D | $37,300 | -- | |
| Conner Lamar | $79,000 | -- | |
| Vining James | $5,500 | -- |
Source: Public Records
Mortgage History
| Date | Status | Borrower | Loan Amount |
|---|---|---|---|
| Previous Owner | Cook Tony | $90,909 | |
| Closed | Fowler Raymond C | $0 |
Source: Public Records
Tax History Compared to Growth
Tax History
| Year | Tax Paid | Tax Assessment Tax Assessment Total Assessment is a certain percentage of the fair market value that is determined by local assessors to be the total taxable value of land and additions on the property. | Land | Improvement |
|---|---|---|---|---|
| 2024 | $3,048 | $87,014 | $4,800 | $82,214 |
| 2023 | $3,048 | $75,046 | $4,800 | $70,246 |
| 2022 | $2,312 | $65,381 | $4,000 | $61,381 |
| 2021 | $1,967 | $55,916 | $4,000 | $51,916 |
| 2020 | $1,764 | $50,147 | $4,000 | $46,147 |
| 2019 | $1,046 | $29,904 | $4,000 | $25,904 |
| 2018 | $982 | $27,521 | $4,000 | $23,521 |
| 2017 | $956 | $27,521 | $4,000 | $23,521 |
| 2016 | $973 | $27,521 | $4,000 | $23,521 |
| 2015 | $1,003 | $27,521 | $4,000 | $23,521 |
| 2014 | $1,023 | $27,521 | $4,000 | $23,521 |
Source: Public Records
Map
Nearby Homes
- 2637 Birdie Rd
- 4251 Fayetteville Rd
- 171 Davidson Dr
- 580 Hardy Ln
- 394 Sidney Dr
- 3701 Fayetteville Rd
- 1019 Oakridge Dr
- 1317 Cheatham Rd
- 164 David Elder Rd
- 1100 Stiles Crossing
- 1102 Stiles Crossing
- 697 Steele Rd
- 0 Deason St Unit 23730
- 0 Deason St Unit 10624935
- 265 Steele Rd
- 1456 Birdie Rd
- 725 County Line Church Rd
- 1972 Pinecrest Dr Unit 4
- 1949 Bonnie Ridge Dr
- 505 New Salem Rd
- 137 Davidson Cir
- 137 Davidson Cir Unit 1
- 129 Davidson Cir
- 2487 Birdie Rd
- 2499 Birdie Rd
- 125 Davidson Cir
- 2481 Birdie Rd
- 122 Davidson Cir
- 141 Davidson Cir
- 2505 Birdie Rd
- 2475 Birdie Rd
- 144 Davidson Cir
- 121 Davidson Cir Unit 53
- 121 Davidson Cir
- 145 Davidson Cir
- 118 Davidson Cir
- 2511 Birdie Rd
- 149 Davidson Cir
- 117 Davidson Cir
- 2463 Birdie Rd