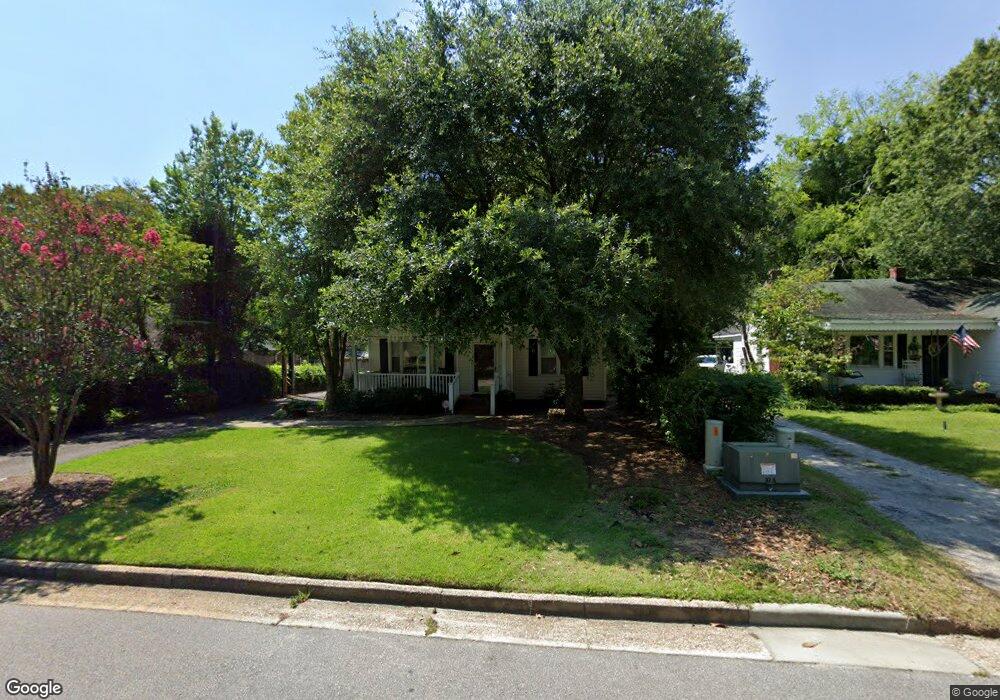
133 E Hampton St Camden, SC 29020
Highlights
- Wood Flooring
- Laundry Room
- Bungalow
About This Home
As of July 2014Great Location. Enjoy great back yard on large porch. Cute built-ins. Private wooded lot, extra storage in shop. Lots of room in attic to be turned into extra space.
Home Details
Home Type
- Single Family
Est. Annual Taxes
- $432
Year Built
- Built in 1950
Home Design
- 1,227 Sq Ft Home
- Bungalow
Flooring
- Wood
- Vinyl
Schools
- Camden Elementary And Middle School
- Camden High School
Additional Features
- 1 Bedroom
- Laundry Room
Ownership History
Purchase Details
Purchase Details
Home Financials for this Owner
Home Financials are based on the most recent Mortgage that was taken out on this home.Purchase Details
Home Values in the Area
Average Home Value in this Area
Purchase History
| Date | Type | Sale Price | Title Company |
|---|---|---|---|
| Deed | -- | Savage Royall & Sheheen Llp | |
| Deed | $63,000 | -- | |
| Deed | $20,000 | -- |
Property History
| Date | Event | Price | Change | Sq Ft Price |
|---|---|---|---|---|
| 07/11/2014 07/11/14 | Sold | $63,000 | -12.5% | $51 / Sq Ft |
| 06/20/2014 06/20/14 | Pending | -- | -- | -- |
| 06/04/2014 06/04/14 | For Sale | $72,000 | -- | $59 / Sq Ft |
Tax History Compared to Growth
Tax History
| Year | Tax Paid | Tax Assessment Tax Assessment Total Assessment is a certain percentage of the fair market value that is determined by local assessors to be the total taxable value of land and additions on the property. | Land | Improvement |
|---|---|---|---|---|
| 2024 | $432 | $109,900 | $40,000 | $69,900 |
| 2023 | $5,476 | $109,900 | $40,000 | $69,900 |
| 2022 | $377 | $109,900 | $40,000 | $69,900 |
| 2021 | $315 | $109,300 | $40,000 | $69,300 |
| 2020 | $269 | $87,500 | $40,000 | $47,500 |
| 2019 | $275 | $87,500 | $40,000 | $47,500 |
| 2018 | $278 | $87,500 | $40,000 | $47,500 |
| 2017 | $264 | $93,000 | $40,000 | $53,000 |
| 2016 | $1,529 | $71,000 | $17,400 | $53,600 |
| 2015 | $91 | $71,000 | $17,400 | $53,600 |
| 2014 | $91 | $0 | $0 | $0 |
Map
Source: Canopy MLS (Canopy Realtor® Association)
MLS Number: P1092261
APN: C271-17-00-078
Disclaimer: Certain information contained herein is derived from information provided by parties other than Homes.com. All information provided is deemed reliable, but is not guaranteed to be accurate and should be independently verified.
![]() Based on information submitted to the MLS GRID. All data is obtained from various sources and may not have been verified by broker or MLS GRID. Supplied Open House Information is subject to change without notice. All information should be independently reviewed and verified for accuracy. Properties may or may not be listed by the office/agent presenting the information. Some IDX listings have been excluded from this website.
Based on information submitted to the MLS GRID. All data is obtained from various sources and may not have been verified by broker or MLS GRID. Supplied Open House Information is subject to change without notice. All information should be independently reviewed and verified for accuracy. Properties may or may not be listed by the office/agent presenting the information. Some IDX listings have been excluded from this website.
The Digital Millennium Copyright Act of 1998, 17 U.S.C. § 512 (the “DMCA”) provides recourse for copyright owners who believe that material appearing on the Internet infringes their rights under U.S. copyright law. If you believe in good faith that any content or material made available in connection with our website or services infringes your copyright, you (or your agent) may send us a notice requesting that the content or material be removed, or access to it blocked.
Notices must be sent in writing by email to DMCAnotice@MLSGrid.com.
The DMCA requires that your notice of alleged copyright infringement include the following information:
(1) description of the copyrighted work that is the subject of claimed infringement;
(2) description of the alleged infringing content and information sufficient to permit us to locate the content;
(3) contact information for you, including your address, telephone number and email address;
(4) a statement by you that you have a good faith belief that the content in the manner complained of is not authorized by the copyright owner, or its agent, or by the operation of any law;
(5) a statement by you, signed under penalty of perjury, that the information in the notification is accurate and that you have the authority to enforce the copyrights that are claimed to be infringed; and
(6) a physical or electronic signature of the copyright owner or a person authorized to act on the copyright owner’s behalf. Failure to include all of the above information may result in the delay of the processing of your complaint.