133 Elm St Andover, MA 01810
East Andover NeighborhoodEstimated Value: $1,110,000 - $1,237,929
About This Home
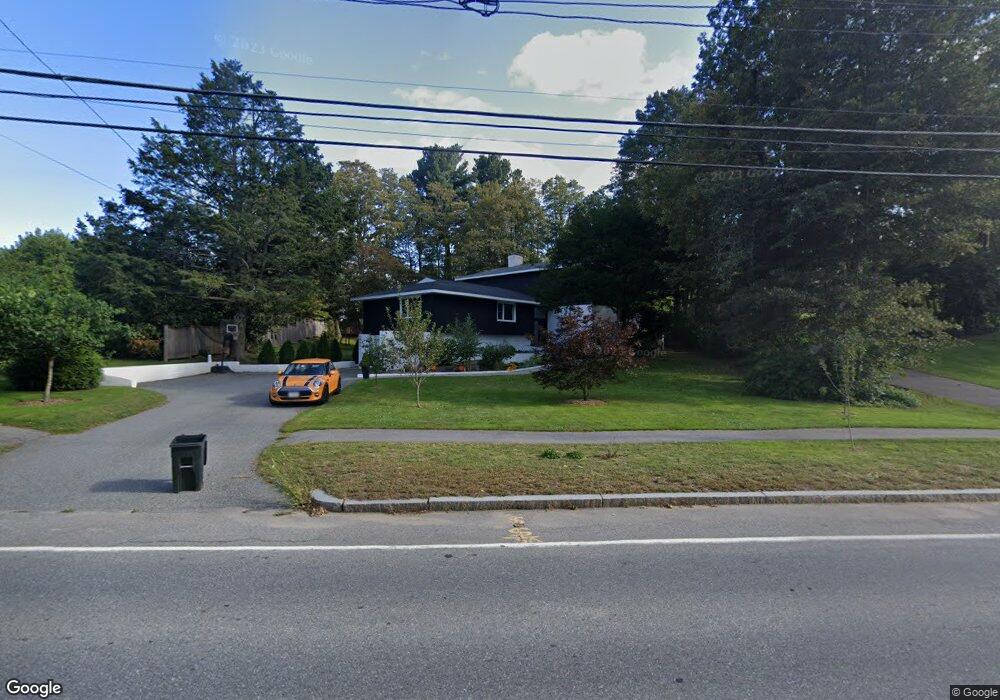
This home is located at 133 Elm St, Andover, MA 01810 and is currently estimated at $1,183,232, approximately $442 per square foot. 133 Elm St is a home located in Essex County with nearby schools including West Elementary School, Doherty Middle School, and Andover High School.
Ownership History
We collect this data history from publicly available records. To have your information removed, we recommend requesting removal directly through your county’s website.
Purchase Details
Home Financials for this Owner
Home Financials are based on the most recent Mortgage that was taken out on this home.Purchase Details
Home Financials for this Owner
Home Financials are based on the most recent Mortgage that was taken out on this home.Home Values in the Area
Average Home Value in this Area
Purchase History
We collect this data history from publicly available records. To have your information removed, we recommend requesting removal directly through your county’s website.
| Date | Buyer | Sale Price | Title Company |
|---|---|---|---|
| $550,000 | -- | ||
| $550,000 | -- | ||
| $550,000 | -- | ||
| $395,000 | -- | ||
| $395,000 | -- |
Mortgage History
We collect this data history from publicly available records. To have your information removed, we recommend requesting removal directly through your county’s website.
| Date | Status | Borrower | Loan Amount |
|---|---|---|---|
| Open | $412,500 | ||
| Closed | $412,500 | ||
| Previous Owner | $75,000 | ||
| Previous Owner | $316,000 |
Tax History
We collect this data history from publicly available records. To have your information removed, we recommend requesting removal directly through your county’s website.
| Year | Tax Paid | Tax Assessment Tax Assessment Total Assessment is a certain percentage of the fair market value that is determined by local assessors to be the total taxable value of land and additions on the property. | Land | Improvement |
|---|---|---|---|---|
| 2025 | $12,034 | $963,500 | $514,700 | $448,800 |
| 2024 | $11,629 | $902,900 | $502,900 | $400,000 |
| 2023 | $11,424 | $836,300 | $465,800 | $370,500 |
| 2022 | $10,328 | $707,400 | $394,800 | $312,600 |
| 2021 | $9,905 | $647,800 | $358,800 | $289,000 |
| 2020 | $9,501 | $633,000 | $350,000 | $283,000 |
| 2019 | $9,109 | $596,500 | $320,600 | $275,900 |
| 2018 | $8,715 | $557,200 | $302,600 | $254,600 |
| 2017 | $8,337 | $549,200 | $296,700 | $252,500 |
| 2016 | $8,139 | $549,200 | $296,700 | $252,500 |
| 2015 | $7,344 | $490,600 | $285,300 | $205,300 |
Map
- 31 Pine St
- 12 Burton Farm Dr
- 13 Carmel Rd
- 156 Elm St
- 9 Stratford Rd
- 58 Maple Ave Unit 58
- 114 Chestnut St
- 16R High St
- 4 Applecrest Rd
- 19 Elm Ct
- 72 High St
- 9 Elm Ct
- 10 Elm Ct
- 10 Crescent Dr Unit 6
- 11 Longwood Dr Unit 7
- 9 Longwood Dr Unit 1
- 33 Chestnut St Unit 2
- 7 Rock o Dundee Rd
- 60 Morton St Unit R
- 1 Rogers Brook E
Ask me questions while you tour the home.