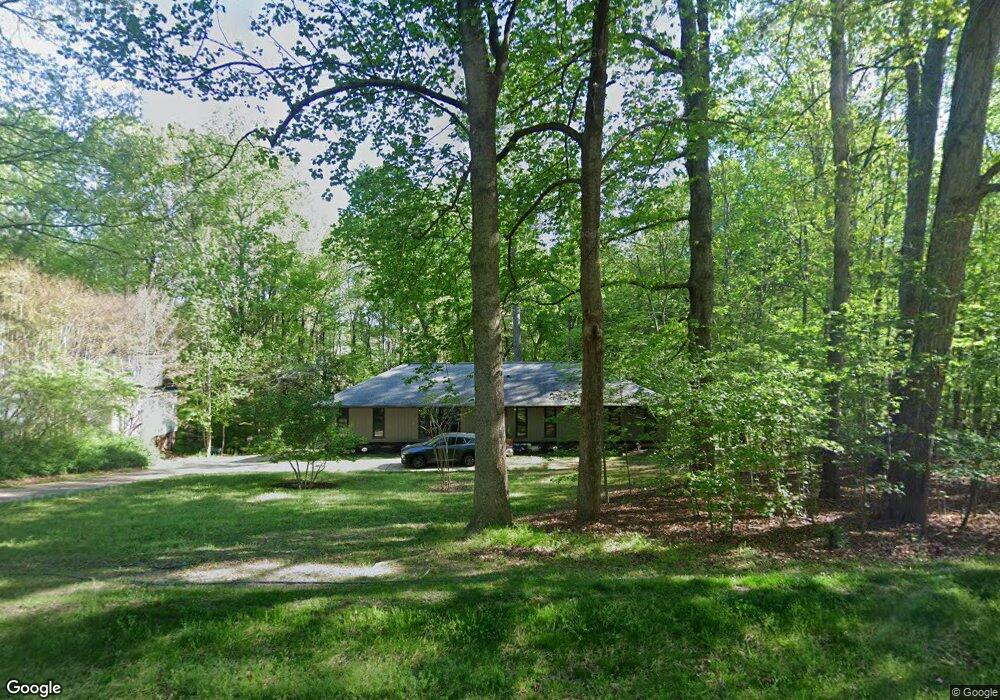
133 Fern Forest Dr Raleigh, NC 27603
Estimated Value: $593,000 - $707,000
--
Bed
3
Baths
2,940
Sq Ft
$228/Sq Ft
Est. Value
About This Home
This home is located at 133 Fern Forest Dr, Raleigh, NC 27603 and is currently estimated at $671,050, approximately $228 per square foot. 133 Fern Forest Dr is a home located in Wake County with nearby schools including Rand Road Elementary, North Garner Middle, and South Garner High.
Ownership History
Date
Name
Owned For
Owner Type
Purchase Details
Closed on
Jul 31, 2023
Sold by
J-Z Ventures & Holdings Llc
Bought by
Cooper Carol and Cooper Eugene
Current Estimated Value
Home Financials for this Owner
Home Financials are based on the most recent Mortgage that was taken out on this home.
Original Mortgage
$270,000
Outstanding Balance
$261,471
Interest Rate
5%
Mortgage Type
New Conventional
Estimated Equity
$409,579
Purchase Details
Closed on
Mar 30, 2010
Sold by
Thomas Charlotte H
Bought by
Thomas Edward M and Thomas Charlotte H
Purchase Details
Closed on
Nov 8, 2009
Sold by
Thomas Edward M and Thomas Charlotte H
Bought by
Thomas Charlotte H
Purchase Details
Closed on
Jul 23, 1993
Bought by
Thomas Edward M and Thomas Charlotte H
Create a Home Valuation Report for This Property
The Home Valuation Report is an in-depth analysis detailing your home's value as well as a comparison with similar homes in the area
Home Values in the Area
Average Home Value in this Area
Purchase History
| Date | Buyer | Sale Price | Title Company |
|---|---|---|---|
| Cooper Carol | $703,000 | None Listed On Document | |
| Cooper Carol | $703,000 | None Listed On Document | |
| Thomas Edward M | -- | None Available | |
| Thomas Charlotte H | -- | None Available | |
| Thomas Edward M | $160,000 | -- |
Source: Public Records
Mortgage History
| Date | Status | Borrower | Loan Amount |
|---|---|---|---|
| Open | Cooper Carol | $270,000 | |
| Closed | Cooper Carol | $270,000 |
Source: Public Records
Tax History Compared to Growth
Tax History
| Year | Tax Paid | Tax Assessment Tax Assessment Total Assessment is a certain percentage of the fair market value that is determined by local assessors to be the total taxable value of land and additions on the property. | Land | Improvement |
|---|---|---|---|---|
| 2025 | $3,301 | $513,014 | $140,000 | $373,014 |
| 2024 | $3,206 | $513,014 | $140,000 | $373,014 |
| 2023 | $2,222 | $283,510 | $50,000 | $233,510 |
| 2022 | $2,060 | $282,420 | $50,000 | $232,420 |
| 2021 | $2,005 | $282,420 | $50,000 | $232,420 |
| 2020 | $1,972 | $282,420 | $50,000 | $232,420 |
| 2019 | $1,937 | $234,720 | $44,000 | $190,720 |
| 2018 | $1,781 | $234,720 | $44,000 | $190,720 |
| 2017 | $1,689 | $234,720 | $44,000 | $190,720 |
| 2016 | $1,655 | $234,720 | $44,000 | $190,720 |
| 2015 | $1,639 | $233,153 | $44,000 | $189,153 |
| 2014 | $1,554 | $233,153 | $44,000 | $189,153 |
Source: Public Records
Map
Nearby Homes
- 1116 Shadywood Ln
- 4117 Bashford Bluffs Ln
- 701 Rand Rd
- 1025 Shadywood Ln
- 920 Shadywood Ln
- 8500 Old Ponderosa Cir
- 169 Montesino Dr
- 8001 Lakeshore Dr
- 316 Arbor Greene Dr
- 901 Edgewater Dr
- 9505 Neils Branch Rd
- 4721 Sandy Bay Cir
- 5013 Contender Dr
- 1036 Blue River Farm Dr
- 9017 Hunterfox Ct
- 172 Bonica Creek Dr
- 166 Bonica Creek Dr
- 191 Bonica Creek Dr
- 100 Bonica Creek Dr
- 2006 Gottwald Ct
- 129 Fern Forest Dr
- 135 Fern Forest Dr
- 145 Fern Forest Dr
- 728 Trebor Dr
- 732 Trebor Dr
- 136 Fern Forest Dr
- 128 Fern Forest Dr
- 125 Fern Forest Dr
- 147 Fern Forest Dr
- 144 Fern Forest Dr
- 724 Trebor Dr
- 148 Fern Forest Dr
- 124 Fern Forest Dr
- 149 Fern Forest Dr
- 121 Fern Forest Dr
- 145 Forest Ln Unit FERN
- 729 Trebor Dr
- 721 Shadywood Ln
- 717 Shadywood Ln
- 152 Fern Forest Dr