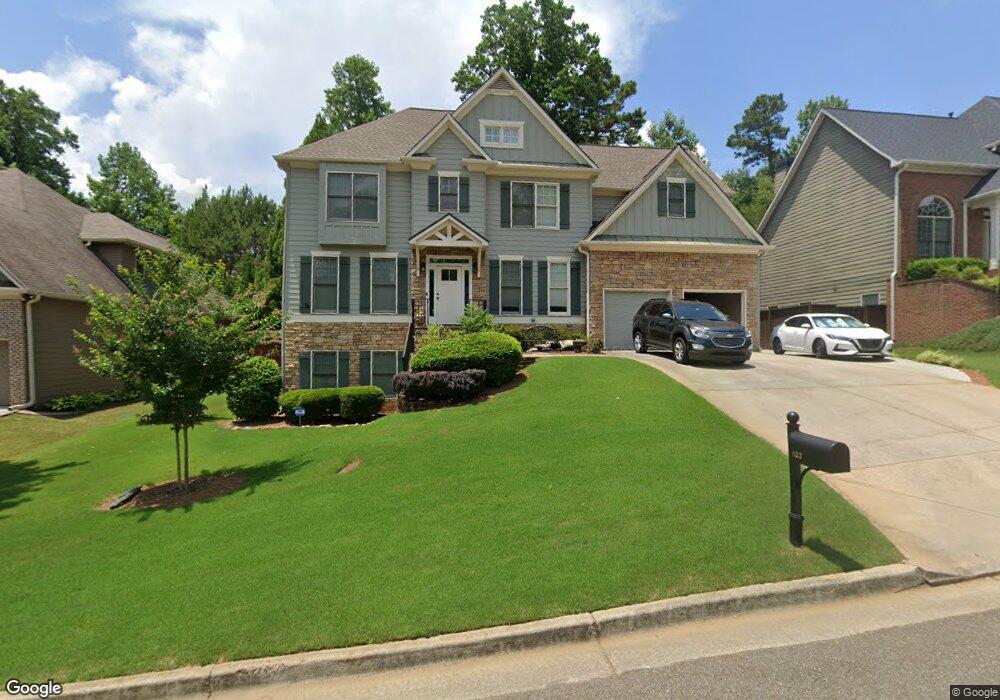
133 Gold Mill Place Unit 4F Canton, GA 30114
Estimated Value: $519,805 - $526,000
5
Beds
4
Baths
2,384
Sq Ft
$219/Sq Ft
Est. Value
About This Home
This home is located at 133 Gold Mill Place Unit 4F, Canton, GA 30114 and is currently estimated at $522,903, approximately $219 per square foot. 133 Gold Mill Place Unit 4F is a home located in Cherokee County with nearby schools including Liberty Elementary School, Freedom Middle School, and Cherokee High School.
Ownership History
Date
Name
Owned For
Owner Type
Purchase Details
Closed on
Nov 28, 2011
Sold by
Federal National Mortgage Association
Bought by
Blake Wendy R
Current Estimated Value
Home Financials for this Owner
Home Financials are based on the most recent Mortgage that was taken out on this home.
Original Mortgage
$202,350
Outstanding Balance
$139,348
Interest Rate
4.15%
Mortgage Type
New Conventional
Estimated Equity
$383,555
Purchase Details
Closed on
Aug 2, 2011
Sold by
Suntrust Mtg Inc
Bought by
Federal National Mtg Associati
Purchase Details
Closed on
Jun 14, 2005
Sold by
Blueridge Residential Inc
Bought by
Ayala Eric K and Ayala Cara
Home Financials for this Owner
Home Financials are based on the most recent Mortgage that was taken out on this home.
Original Mortgage
$224,900
Interest Rate
7.87%
Mortgage Type
New Conventional
Create a Home Valuation Report for This Property
The Home Valuation Report is an in-depth analysis detailing your home's value as well as a comparison with similar homes in the area
Home Values in the Area
Average Home Value in this Area
Purchase History
| Date | Buyer | Sale Price | Title Company |
|---|---|---|---|
| Blake Wendy R | -- | -- | |
| Federal National Mtg Associati | $221,346 | -- | |
| Suntrust Mtg Inc | $221,346 | -- | |
| Ayala Eric K | $269,900 | -- |
Source: Public Records
Mortgage History
| Date | Status | Borrower | Loan Amount |
|---|---|---|---|
| Open | Blake Wendy R | $202,350 | |
| Previous Owner | Ayala Eric K | $224,900 |
Source: Public Records
Tax History Compared to Growth
Tax History
| Year | Tax Paid | Tax Assessment Tax Assessment Total Assessment is a certain percentage of the fair market value that is determined by local assessors to be the total taxable value of land and additions on the property. | Land | Improvement |
|---|---|---|---|---|
| 2024 | $5,180 | $199,320 | $38,000 | $161,320 |
| 2023 | $5,034 | $193,720 | $38,000 | $155,720 |
| 2022 | $4,438 | $168,840 | $35,200 | $133,640 |
| 2021 | $4,032 | $142,040 | $25,600 | $116,440 |
| 2020 | $3,595 | $126,520 | $25,600 | $100,920 |
| 2019 | $3,463 | $121,880 | $25,600 | $96,280 |
| 2018 | $3,201 | $111,960 | $24,000 | $87,960 |
| 2017 | $3,151 | $273,400 | $20,400 | $88,960 |
| 2016 | $3,025 | $259,800 | $20,400 | $83,520 |
| 2015 | $2,961 | $251,800 | $18,000 | $82,720 |
| 2014 | $2,877 | $244,200 | $18,000 | $79,680 |
Source: Public Records
Map
Nearby Homes
- 139 Gold Mill Place Unit 4F
- 152 Gold Mill Place Unit 4F
- 342 Providence Walk Way
- 252 Deer Valley Run
- 272 Deer Valley Run
- 292 Deer Valley Run
- 259 Deer Valley Run
- 273 Deer Valley Run
- 305 Deer Valley Run
- 309 Deer Valley Run
- 422 Arrowhead Trail
- 410 Arrowhead Trail
- 404 Providence Walk St
- 429 Arrowhead Trail
- 106 Henley St
- 135 Henley St
- 129 Henley St
- 138 Henley St Unit 10
- 131 Gold Mill Place Unit 4F
- 135 Gold Mill Place Unit 4F
- 129 Gold Mill Place Unit 4F
- 137 Gold Mill Place
- 137 Gold Mill Place Unit 4F
- 304 Mill Ridge Unit 4F
- 134 Gold Mill Place
- 132 Gold Mill Place Unit 4F
- 136 Gold Mill Place
- 130 Gold Mill Place Unit 4F
- 127 Gold Mill Place Unit 4F
- 307 Mill Ridge
- 138 Gold Mill Place
- 151 Gold Mill Place Unit 1
- 151 Gold Mill Place Unit 4F
- 151 Gold Mill Place Unit 151
- 151 Gold Mill Place
- 128 Gold Mill Place Unit 4F
- 125 Gold Mill Place
- 140 Gold Mill Place