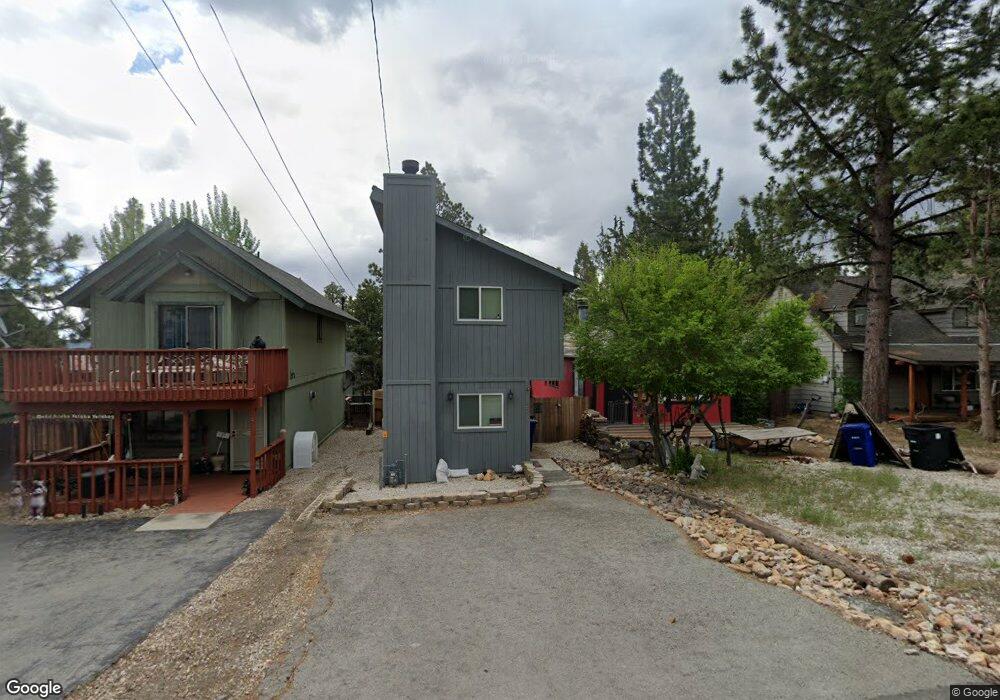
133 Leonard Ln Sugarloaf, CA 92386
Estimated Value: $264,932 - $313,000
2
Beds
1
Bath
972
Sq Ft
$292/Sq Ft
Est. Value
About This Home
This home is located at 133 Leonard Ln, Sugarloaf, CA 92386 and is currently estimated at $283,983, approximately $292 per square foot. 133 Leonard Ln is a home with nearby schools including Baldwin Lane Elementary School, Big Bear Middle School, and Big Bear High School.
Ownership History
Date
Name
Owned For
Owner Type
Purchase Details
Closed on
Oct 24, 2014
Sold by
Ludwig Brent M and Ludwig Laura
Bought by
Ludwig Brent M and Ludwig Laura
Current Estimated Value
Purchase Details
Closed on
Apr 24, 2013
Sold by
Ludwig Brent M and Ludwig Laura
Bought by
Ludwig Brent M and Ludwig Laura
Purchase Details
Closed on
Nov 11, 2010
Sold by
Wallstedt Eric and Wallstedt Leslie
Bought by
Ludwig Brent M and Ludwig Laura
Home Financials for this Owner
Home Financials are based on the most recent Mortgage that was taken out on this home.
Original Mortgage
$80,000
Outstanding Balance
$52,675
Interest Rate
4.23%
Mortgage Type
Seller Take Back
Estimated Equity
$231,308
Purchase Details
Closed on
Oct 25, 2004
Sold by
Tamoush Philip P and Tamoush Artemis C
Bought by
Wallstedt Eric and Wallstedt Leslie
Home Financials for this Owner
Home Financials are based on the most recent Mortgage that was taken out on this home.
Original Mortgage
$12,800
Interest Rate
5.64%
Mortgage Type
Credit Line Revolving
Create a Home Valuation Report for This Property
The Home Valuation Report is an in-depth analysis detailing your home's value as well as a comparison with similar homes in the area
Home Values in the Area
Average Home Value in this Area
Purchase History
| Date | Buyer | Sale Price | Title Company |
|---|---|---|---|
| Ludwig Brent M | -- | None Available | |
| Ludwig Brent M | -- | None Available | |
| Ludwig Brent M | $90,000 | Chicago Title Inland Empire | |
| Wallstedt Eric | $128,000 | Commonwealth Title |
Source: Public Records
Mortgage History
| Date | Status | Borrower | Loan Amount |
|---|---|---|---|
| Open | Ludwig Brent M | $80,000 | |
| Previous Owner | Wallstedt Eric | $12,800 | |
| Previous Owner | Wallstedt Eric | $102,400 |
Source: Public Records
Tax History Compared to Growth
Tax History
| Year | Tax Paid | Tax Assessment Tax Assessment Total Assessment is a certain percentage of the fair market value that is determined by local assessors to be the total taxable value of land and additions on the property. | Land | Improvement |
|---|---|---|---|---|
| 2025 | $2,461 | $115,303 | $23,060 | $92,243 |
| 2024 | $2,461 | $113,042 | $22,608 | $90,434 |
| 2023 | $2,368 | $110,826 | $22,165 | $88,661 |
| 2022 | $2,262 | $108,653 | $21,730 | $86,923 |
| 2021 | $2,206 | $106,523 | $21,304 | $85,219 |
| 2020 | $2,191 | $105,431 | $21,086 | $84,345 |
| 2019 | $2,140 | $103,364 | $20,673 | $82,691 |
| 2018 | $2,057 | $101,338 | $20,268 | $81,070 |
| 2017 | $1,996 | $99,351 | $19,871 | $79,480 |
| 2016 | $1,944 | $97,403 | $19,481 | $77,922 |
| 2015 | $1,908 | $95,940 | $19,188 | $76,752 |
| 2014 | $1,869 | $94,061 | $18,812 | $75,249 |
Source: Public Records
Map
Nearby Homes
- 142 Leonard Ln
- 170 Wabash Ln
- 165 Sunset Ln
- 115 Sunset Ln
- 196 Sunset Ln
- 225 Sunset Ln
- 195 Vista Ln
- 169 Imperial Ave
- 230 Vista Ave
- 156 Victoria Ln
- 284 Leonard Ln
- 298 Holmes Ln
- 253 Imperial Ave
- 48268 Curvate Baldwin Ln
- 130 Maple Ln
- 266 Victoria Ln
- 329 Vista Ln
- 313 Leonard Ln
- 343 Holmes Ln
- 317 Moreno Ln