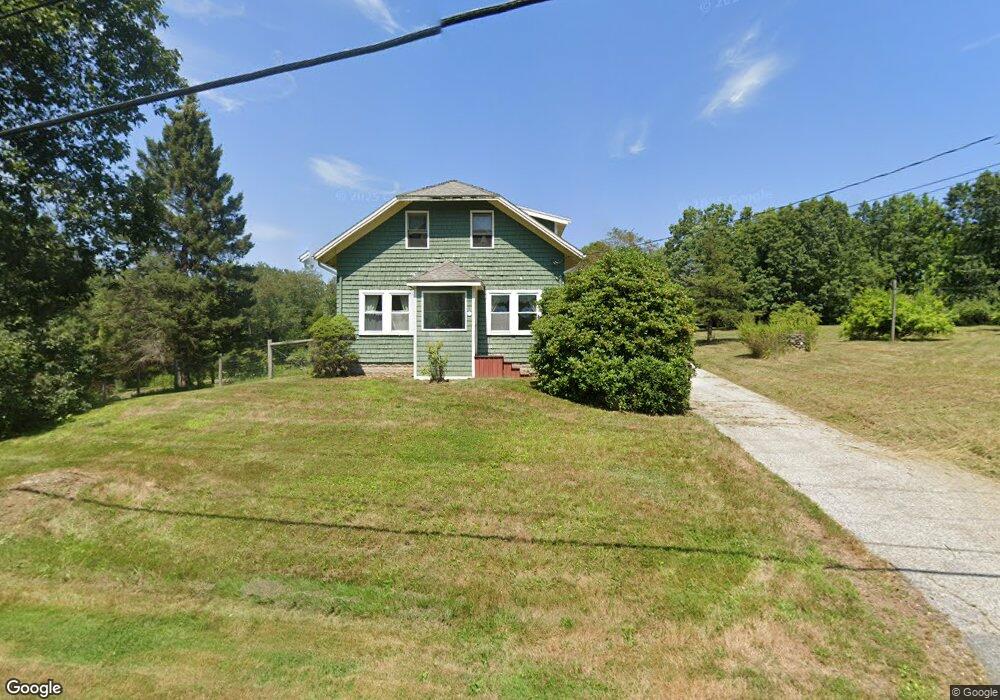
133 Main Ave South Hampton, NH 03827
Estimated Value: $718,000 - $781,000
3
Beds
2
Baths
2,423
Sq Ft
$305/Sq Ft
Est. Value
About This Home
This home is located at 133 Main Ave, South Hampton, NH 03827 and is currently estimated at $740,104, approximately $305 per square foot. 133 Main Ave is a home located in Rockingham County with nearby schools including South Hampton Barnard School, Winnacunnet High School, and Amesbury Seventh-Day Adventist School.
Ownership History
Date
Name
Owned For
Owner Type
Purchase Details
Closed on
Nov 16, 1998
Sold by
Lopez Mark
Bought by
Coman Carolyn L
Current Estimated Value
Home Financials for this Owner
Home Financials are based on the most recent Mortgage that was taken out on this home.
Original Mortgage
$133,200
Outstanding Balance
$29,228
Interest Rate
6.65%
Estimated Equity
$710,876
Create a Home Valuation Report for This Property
The Home Valuation Report is an in-depth analysis detailing your home's value as well as a comparison with similar homes in the area
Home Values in the Area
Average Home Value in this Area
Purchase History
| Date | Buyer | Sale Price | Title Company |
|---|---|---|---|
| Coman Carolyn L | $166,500 | -- |
Source: Public Records
Mortgage History
| Date | Status | Borrower | Loan Amount |
|---|---|---|---|
| Open | Coman Carolyn L | $133,200 |
Source: Public Records
Tax History Compared to Growth
Tax History
| Year | Tax Paid | Tax Assessment Tax Assessment Total Assessment is a certain percentage of the fair market value that is determined by local assessors to be the total taxable value of land and additions on the property. | Land | Improvement |
|---|---|---|---|---|
| 2024 | $9,271 | $671,800 | $260,300 | $411,500 |
| 2023 | $9,271 | $671,800 | $260,300 | $411,500 |
| 2022 | $8,464 | $426,200 | $149,700 | $276,500 |
| 2021 | $8,494 | $426,200 | $149,700 | $276,500 |
| 2020 | $8,094 | $426,200 | $149,700 | $276,500 |
| 2019 | $7,608 | $426,200 | $149,700 | $276,500 |
| 2018 | $22 | $426,200 | $149,700 | $276,500 |
| 2017 | $6,367 | $351,600 | $137,700 | $213,900 |
| 2016 | $6,410 | $351,600 | $137,700 | $213,900 |
| 2015 | $7,007 | $351,600 | $137,700 | $213,900 |
| 2014 | $6,534 | $349,400 | $137,700 | $211,700 |
| 2012 | $6,000 | $406,800 | $195,400 | $211,400 |
Source: Public Records
Map
Nearby Homes
- 43 Main Ave
- 21 Currier St
- 10 Mason Ct Unit 10
- 4 Currier St
- 28 Powderhouse Ct Unit 28
- 1 Tuxbury Ln
- 152 Kimball Rd
- 155 Chase Rd
- 2 Brookside Ln
- 48 South Rd
- 7 Currierville Rd
- 43 Maple Ave
- 16 Glen Devin St
- 3 Glen Devin St
- 4 Woodsom Dr
- 25 Whittier Meadows Dr
- 9 Bowley Rd
- 2 Locke Hill Ln
- 129 Haverhill Rd
- 17 Maple Ave