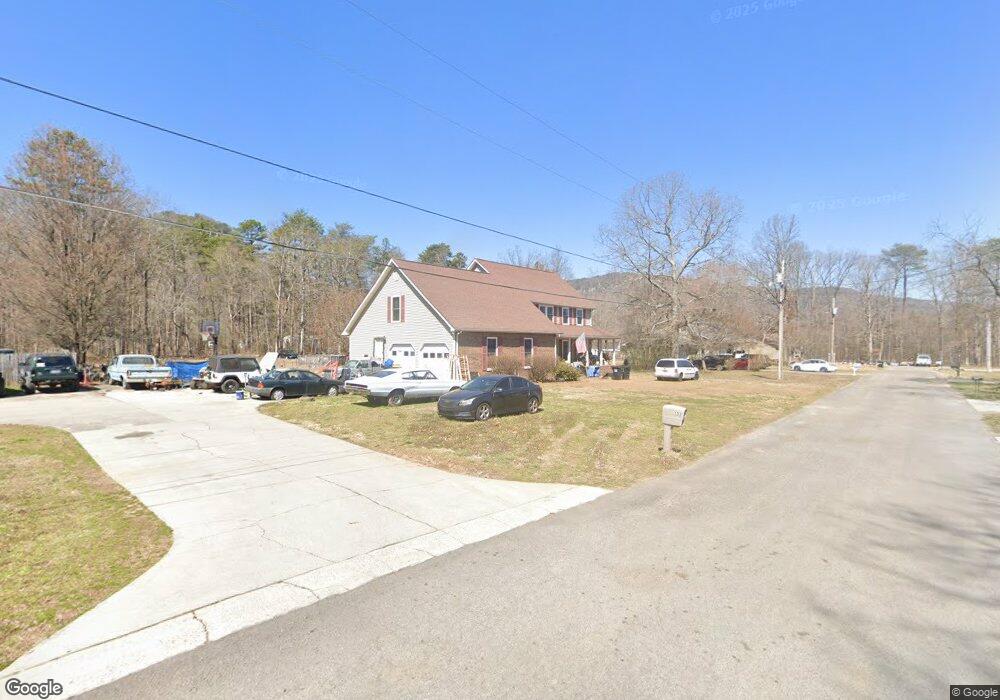
133 Maple St Dunlap, TN 37327
Estimated Value: $290,000 - $408,000
Studio
3
Baths
2,749
Sq Ft
$127/Sq Ft
Est. Value
About This Home
This home is located at 133 Maple St, Dunlap, TN 37327 and is currently estimated at $349,514, approximately $127 per square foot. 133 Maple St is a home located in Sequatchie County with nearby schools including Griffith Elementary School, Sequatchie County Middle School, and Sequatchie County High School.
Ownership History
Date
Name
Owned For
Owner Type
Purchase Details
Closed on
Jun 16, 2004
Sold by
Snyder Carol S
Bought by
Steenhoven Aaron D
Current Estimated Value
Purchase Details
Closed on
May 26, 2004
Bought by
Snyder Carol S
Purchase Details
Closed on
Jul 17, 2001
Sold by
Burgess Barry L and Burgess Donna E
Bought by
Snyder Kevin K and Snyder Carol S
Home Financials for this Owner
Home Financials are based on the most recent Mortgage that was taken out on this home.
Original Mortgage
$126,875
Interest Rate
7.08%
Purchase Details
Closed on
Jan 25, 1992
Bought by
Burgess Donna Eugenia and Husband Barry Lee
Purchase Details
Closed on
Jan 3, 1990
Bought by
Harmon Eugene and Wife Jewell
Create a Home Valuation Report for This Property
The Home Valuation Report is an in-depth analysis detailing your home's value as well as a comparison with similar homes in the area
Home Values in the Area
Average Home Value in this Area
Purchase History
| Date | Buyer | Sale Price | Title Company |
|---|---|---|---|
| Steenhoven Aaron D | $145,000 | -- | |
| Snyder Carol S | -- | -- | |
| Snyder Kevin K | $135,000 | -- | |
| Burgess Donna Eugenia | $5,000 | -- | |
| Harmon Eugene | $2,500 | -- |
Source: Public Records
Mortgage History
| Date | Status | Borrower | Loan Amount |
|---|---|---|---|
| Previous Owner | Harmon Eugene | $126,875 |
Source: Public Records
Tax History
| Year | Tax Paid | Tax Assessment Tax Assessment Total Assessment is a certain percentage of the fair market value that is determined by local assessors to be the total taxable value of land and additions on the property. | Land | Improvement |
|---|---|---|---|---|
| 2025 | -- | $75,925 | $5,625 | $70,300 |
| 2024 | -- | $75,925 | $5,625 | $70,300 |
| 2023 | $1,833 | $75,925 | $5,625 | $70,300 |
| 2022 | $1,390 | $41,875 | $3,975 | $37,900 |
| 2021 | $1,369 | $41,875 | $3,975 | $37,900 |
| 2020 | $1,369 | $41,875 | $3,975 | $37,900 |
| 2019 | $1,309 | $40,050 | $2,150 | $37,900 |
| 2018 | $1,294 | $40,050 | $2,150 | $37,900 |
| 2017 | $1,279 | $40,050 | $2,150 | $37,900 |
| 2016 | $1,295 | $38,900 | $2,150 | $36,750 |
| 2015 | $1,296 | $38,900 | $2,150 | $36,750 |
| 2014 | $1,296 | $38,900 | $2,150 | $36,750 |
Source: Public Records
Map
Nearby Homes
- 116 Maple St
- 563 Old Union Rd
- 1038 Sawmill Creek Rd
- 18298 Rankin Ave
- 481 Tram Trail
- 79 Bear Oak Dr
- 496 Boyd Rd
- 249 Bear Oak Dr
- 157 Bear Oak Dr
- 217 A Day Dream Dr
- 267 Williams Rd
- 1 W Brow Rd
- 87 Happy Valley Rd
- 1086 River Ridge Dr
- 1086 River Ridge Dr Unit Lot 58
- 1473 Old York Hwy N
- 453 Hill Cir
- 12 Fredonia Rd
- 0 Fredonia Loop
- 2003 Fredonia Rd
Your Personal Tour Guide
Ask me questions while you tour the home.