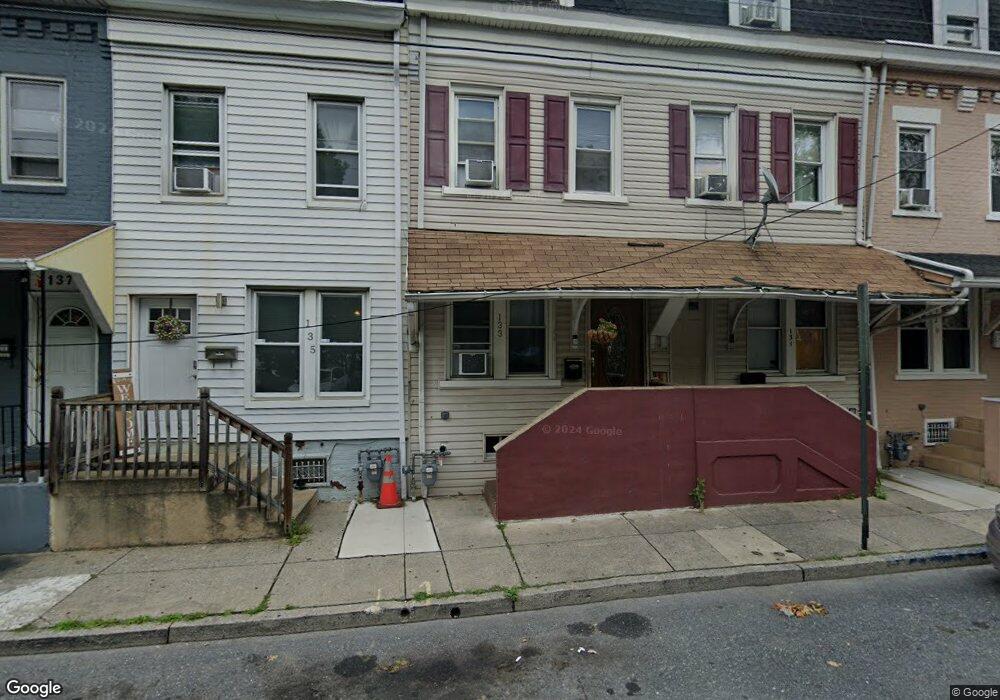
133 N 3rd St Allentown, PA 18101
1st Ward NeighborhoodEstimated Value: $147,010 - $203,000
5
Beds
1
Bath
1,478
Sq Ft
$118/Sq Ft
Est. Value
About This Home
This home is located at 133 N 3rd St, Allentown, PA 18101 and is currently estimated at $174,753, approximately $118 per square foot. 133 N 3rd St is a home located in Lehigh County with nearby schools including Sheridan Elementary School, Harrison-Morton Middle School, and Louis E. Dieruff High School.
Ownership History
Date
Name
Owned For
Owner Type
Purchase Details
Closed on
May 13, 2019
Sold by
Rodriguez Otto and Rodriguez Candida A
Bought by
Rodriguez Yasaira I
Current Estimated Value
Purchase Details
Closed on
Jan 31, 2018
Sold by
Rodriguez Otto and Rodriguez Candida A
Bought by
Rodriguez Otto and Rodriguez Candida A
Purchase Details
Closed on
Apr 30, 1999
Sold by
Kightlinger Guy E and Kightlinger Emily S
Bought by
State Street Bank & Trust Company
Purchase Details
Closed on
Apr 21, 1989
Sold by
Zacirka Todd W
Bought by
Kightlinger Guy E and Kightlinger Emily S
Purchase Details
Closed on
Apr 15, 1985
Bought by
Zacirka Todd W
Create a Home Valuation Report for This Property
The Home Valuation Report is an in-depth analysis detailing your home's value as well as a comparison with similar homes in the area
Home Values in the Area
Average Home Value in this Area
Purchase History
| Date | Buyer | Sale Price | Title Company |
|---|---|---|---|
| Rodriguez Yasaira I | -- | None Available | |
| Rodriguez Otto | -- | None Available | |
| State Street Bank & Trust Company | -- | -- | |
| Kightlinger Guy E | $35,900 | -- | |
| Zacirka Todd W | $24,000 | -- |
Source: Public Records
Tax History Compared to Growth
Tax History
| Year | Tax Paid | Tax Assessment Tax Assessment Total Assessment is a certain percentage of the fair market value that is determined by local assessors to be the total taxable value of land and additions on the property. | Land | Improvement |
|---|---|---|---|---|
| 2025 | $1,550 | $48,900 | $2,100 | $46,800 |
| 2024 | $1,550 | $48,900 | $2,100 | $46,800 |
| 2023 | $1,550 | $48,900 | $2,100 | $46,800 |
| 2022 | $1,494 | $48,900 | $46,800 | $2,100 |
| 2021 | $1,464 | $48,900 | $2,100 | $46,800 |
| 2020 | $1,424 | $48,900 | $2,100 | $46,800 |
| 2019 | $1,401 | $48,900 | $2,100 | $46,800 |
| 2018 | $1,313 | $48,900 | $2,100 | $46,800 |
| 2017 | $1,279 | $48,900 | $2,100 | $46,800 |
| 2016 | $180 | $48,900 | $2,100 | $46,800 |
| 2015 | -- | $48,900 | $2,100 | $46,800 |
| 2014 | -- | $48,900 | $2,100 | $46,800 |
Source: Public Records
Map
Nearby Homes
- 137 N 3rd St
- 127 N Bryan St
- 172 Chestnut St
- 30 N 2nd St Unit 2
- 217 N Grant St
- 182 W Chew St
- 213 W Chew St
- 201 Ridge Ave
- 201 N 4th St
- 408 N 2nd St
- 222 N Front St
- 336 N Limestone St
- 418 Spruce St
- 384 W Gordon St
- 308 W Liberty St
- 115 N Penn St
- 418 N Jordan St
- 215 W Liberty St
- 389 Walnut Ln
- 516 N 2nd St