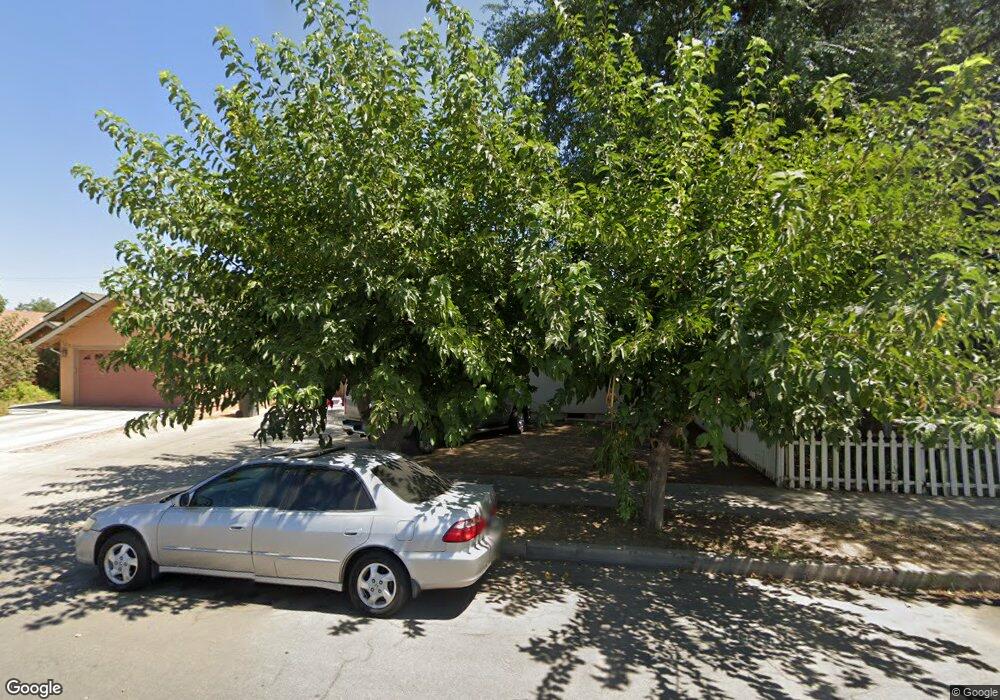
133 N Quince Ave Exeter, CA 93221
Estimated Value: $311,000 - $344,000
3
Beds
2
Baths
1,400
Sq Ft
$238/Sq Ft
Est. Value
About This Home
This home is located at 133 N Quince Ave, Exeter, CA 93221 and is currently estimated at $333,315, approximately $238 per square foot. 133 N Quince Ave is a home located in Tulare County with nearby schools including Sierra View Junior Academy.
Ownership History
Date
Name
Owned For
Owner Type
Purchase Details
Closed on
May 11, 2010
Sold by
Castro Marybelle Avila
Bought by
Robles Misael Yepez and Garibay Irma Barajas
Current Estimated Value
Home Financials for this Owner
Home Financials are based on the most recent Mortgage that was taken out on this home.
Original Mortgage
$138,139
Interest Rate
5.25%
Mortgage Type
FHA
Purchase Details
Closed on
Oct 23, 2008
Sold by
Avila Laura Vasquez and Castro Faustino
Bought by
Castro Marybelle Avila
Purchase Details
Closed on
Jan 2, 2008
Sold by
Vasquez Gabriel O
Bought by
Avila Laura Vasquez
Purchase Details
Closed on
Jun 16, 2005
Sold by
Williams Terrill Porter and Varo Jacinta Avila
Bought by
Vasquez Gabriel O
Home Financials for this Owner
Home Financials are based on the most recent Mortgage that was taken out on this home.
Original Mortgage
$13,000
Interest Rate
5.72%
Mortgage Type
Seller Take Back
Create a Home Valuation Report for This Property
The Home Valuation Report is an in-depth analysis detailing your home's value as well as a comparison with similar homes in the area
Home Values in the Area
Average Home Value in this Area
Purchase History
| Date | Buyer | Sale Price | Title Company |
|---|---|---|---|
| Robles Misael Yepez | $140,000 | Chicago Title Company | |
| Castro Marybelle Avila | -- | None Available | |
| Avila Laura Vasquez | -- | None Available | |
| Vasquez Gabriel O | $63,000 | Fidelity National Title |
Source: Public Records
Mortgage History
| Date | Status | Borrower | Loan Amount |
|---|---|---|---|
| Previous Owner | Robles Misael Yepez | $138,139 | |
| Previous Owner | Vasquez Gabriel O | $13,000 |
Source: Public Records
Tax History Compared to Growth
Tax History
| Year | Tax Paid | Tax Assessment Tax Assessment Total Assessment is a certain percentage of the fair market value that is determined by local assessors to be the total taxable value of land and additions on the property. | Land | Improvement |
|---|---|---|---|---|
| 2025 | $1,903 | $180,713 | $45,177 | $135,536 |
| 2024 | $1,903 | $177,171 | $44,292 | $132,879 |
| 2023 | $1,852 | $173,698 | $43,424 | $130,274 |
| 2022 | $1,813 | $170,293 | $42,573 | $127,720 |
| 2021 | $1,797 | $166,954 | $41,738 | $125,216 |
| 2020 | $1,777 | $165,242 | $41,310 | $123,932 |
| 2019 | $1,722 | $162,002 | $40,500 | $121,502 |
| 2018 | $1,644 | $158,826 | $39,706 | $119,120 |
| 2017 | $1,624 | $155,711 | $38,927 | $116,784 |
| 2016 | $1,562 | $152,658 | $38,164 | $114,494 |
| 2015 | $1,544 | $150,365 | $37,591 | $112,774 |
| 2014 | $1,544 | $147,420 | $36,855 | $110,565 |
Source: Public Records
Map
Nearby Homes
- 137 N H St
- 124 S Filbert Rd
- 308 W Visalia Rd
- 707 W Pine St
- 570 Little Ln
- 713 W Pine St
- 350 N Filbert Rd
- 224 N E St
- 314 N Albert Ave Unit 3
- 314 N Albert Ave Unit 62
- 314 N Albert Ave Unit 39
- 314 N Albert Ave Unit 101
- 314 N Albert Ave Unit 126
- 531 W Firebaugh Ave
- 0 Avenue 276
- 510 S Quince Ave
- 345 N D St
- 606 N Orange Ave
- 210 Plum Dr
- 233 N C St
- 141 N Quince Ave
- 125 N Quince Ave
- 147 N Quince Ave
- 119 N Quince Ave
- 157 N Quince Ave
- 136 N Filbert Rd
- 142 N Filbert Rd
- 124 N Filbert Rd
- 148 N Filbert Rd
- 324 W Palm St
- 118 N Filbert Rd
- 154 N Filbert Rd
- 435 W Pine St
- 132 N Quince Ave
- 429 W Pine St
- 447 W Pine St
- 140 N Quince Ave
- 148 N Quince Ave
- 112 N Filbert Rd
- 126 N Quince Ave