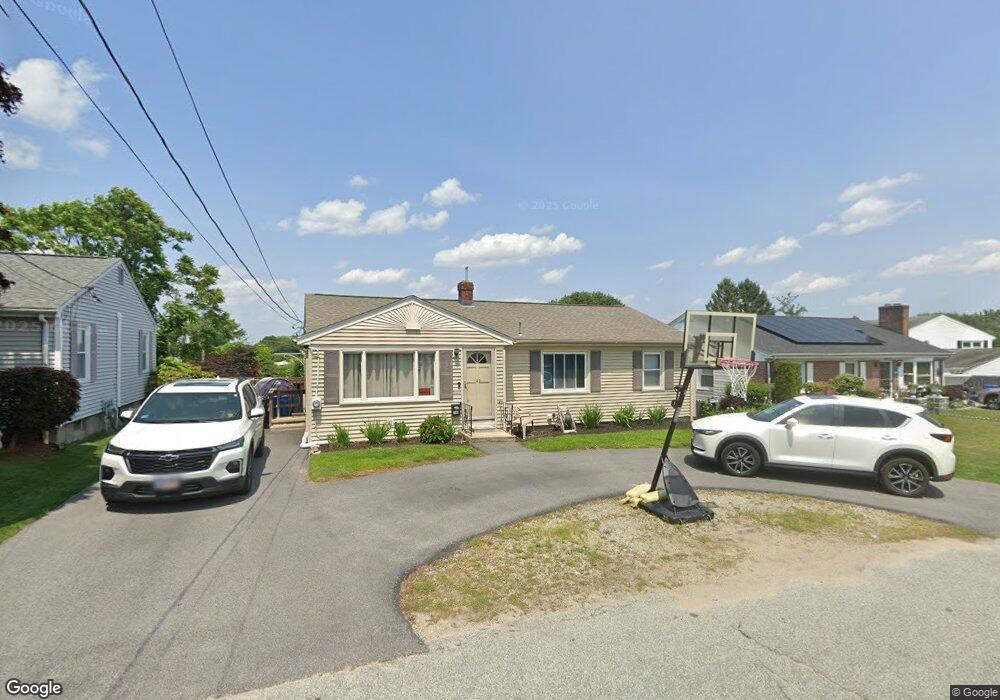
133 N View Ave Cranston, RI 02920
Budlong NeighborhoodEstimated Value: $384,379 - $472,000
3
Beds
2
Baths
1,126
Sq Ft
$380/Sq Ft
Est. Value
About This Home
This home is located at 133 N View Ave, Cranston, RI 02920 and is currently estimated at $427,595, approximately $379 per square foot. 133 N View Ave is a home located in Providence County with nearby schools including Woodridge Elementary School, Western Hills Middle School, and Cranston High School West.
Ownership History
Date
Name
Owned For
Owner Type
Purchase Details
Closed on
Jun 17, 2013
Sold by
Pagano Diane M
Bought by
Vito Jonathan and Vito Stephanie J
Current Estimated Value
Home Financials for this Owner
Home Financials are based on the most recent Mortgage that was taken out on this home.
Original Mortgage
$122,761
Outstanding Balance
$86,935
Interest Rate
3.39%
Mortgage Type
New Conventional
Estimated Equity
$340,660
Purchase Details
Closed on
May 21, 2013
Sold by
Malarado Frank Est
Bought by
Pagano Diane M
Home Financials for this Owner
Home Financials are based on the most recent Mortgage that was taken out on this home.
Original Mortgage
$122,761
Outstanding Balance
$86,935
Interest Rate
3.39%
Mortgage Type
New Conventional
Estimated Equity
$340,660
Create a Home Valuation Report for This Property
The Home Valuation Report is an in-depth analysis detailing your home's value as well as a comparison with similar homes in the area
Home Values in the Area
Average Home Value in this Area
Purchase History
| Date | Buyer | Sale Price | Title Company |
|---|---|---|---|
| Vito Jonathan | $127,000 | -- | |
| Pagano Diane M | -- | -- |
Source: Public Records
Mortgage History
| Date | Status | Borrower | Loan Amount |
|---|---|---|---|
| Open | Pagano Diane M | $122,761 |
Source: Public Records
Tax History
| Year | Tax Paid | Tax Assessment Tax Assessment Total Assessment is a certain percentage of the fair market value that is determined by local assessors to be the total taxable value of land and additions on the property. | Land | Improvement |
|---|---|---|---|---|
| 2025 | $4,449 | $320,500 | $98,900 | $221,600 |
| 2024 | $4,362 | $320,500 | $98,900 | $221,600 |
| 2023 | $4,343 | $229,800 | $68,200 | $161,600 |
| 2022 | $4,254 | $229,800 | $68,200 | $161,600 |
| 2021 | $4,136 | $229,800 | $68,200 | $161,600 |
| 2020 | $3,896 | $187,600 | $64,800 | $122,800 |
| 2019 | $3,896 | $187,600 | $64,800 | $122,800 |
| 2018 | $3,806 | $187,600 | $64,800 | $122,800 |
| 2017 | $3,533 | $154,000 | $47,800 | $106,200 |
| 2016 | $3,457 | $154,000 | $47,800 | $106,200 |
| 2015 | $3,457 | $154,000 | $47,800 | $106,200 |
| 2014 | $3,401 | $148,900 | $47,800 | $101,100 |
Source: Public Records
Map
Nearby Homes
Your Personal Tour Guide
Ask me questions while you tour the home.