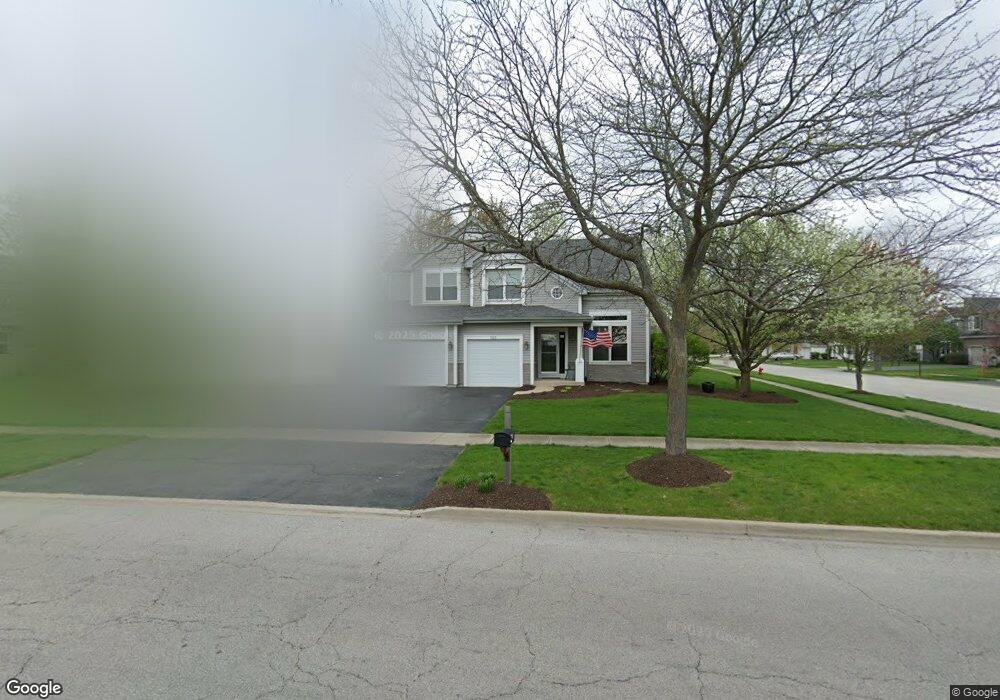
133 Old Post Rd Oswego, IL 60543
North Oswego NeighborhoodEstimated Value: $407,000 - $458,000
4
Beds
3
Baths
2,423
Sq Ft
$182/Sq Ft
Est. Value
About This Home
This home is located at 133 Old Post Rd, Oswego, IL 60543 and is currently estimated at $440,347, approximately $181 per square foot. 133 Old Post Rd is a home located in Kendall County with nearby schools including Old Post Elementary School, Thompson Jr. High School, and Oswego High School.
Ownership History
Date
Name
Owned For
Owner Type
Purchase Details
Closed on
Mar 12, 2021
Sold by
Carter David S and Carter Laura W
Bought by
David Scott Carter Trust and Laura W Carter Trust
Current Estimated Value
Purchase Details
Closed on
Apr 30, 2004
Sold by
Urban Edward L
Bought by
Carter David S and Carter Laura W
Home Financials for this Owner
Home Financials are based on the most recent Mortgage that was taken out on this home.
Original Mortgage
$255,000
Interest Rate
4.79%
Mortgage Type
Purchase Money Mortgage
Purchase Details
Closed on
May 14, 1998
Sold by
Urban Peggy L
Bought by
Urban Edward L
Purchase Details
Closed on
Jul 1, 1994
Bought by
Urban Jr Edward L and Urban Peggy L
Purchase Details
Closed on
Nov 1, 1993
Bought by
D J Horton Inc
Create a Home Valuation Report for This Property
The Home Valuation Report is an in-depth analysis detailing your home's value as well as a comparison with similar homes in the area
Home Values in the Area
Average Home Value in this Area
Purchase History
| Date | Buyer | Sale Price | Title Company |
|---|---|---|---|
| David Scott Carter Trust | -- | None Listed On Document | |
| Carter David S | $255,000 | Multiple | |
| Urban Edward L | -- | -- | |
| Urban Jr Edward L | $198,600 | -- | |
| D J Horton Inc | $2,500,000 | -- |
Source: Public Records
Mortgage History
| Date | Status | Borrower | Loan Amount |
|---|---|---|---|
| Previous Owner | Carter David S | $255,000 | |
| Closed | D J Horton Inc | -- |
Source: Public Records
Tax History
| Year | Tax Paid | Tax Assessment Tax Assessment Total Assessment is a certain percentage of the fair market value that is determined by local assessors to be the total taxable value of land and additions on the property. | Land | Improvement |
|---|---|---|---|---|
| 2024 | $9,641 | $125,801 | $23,745 | $102,056 |
| 2023 | $8,681 | $111,328 | $21,013 | $90,315 |
| 2022 | $8,681 | $102,136 | $19,278 | $82,858 |
| 2021 | $8,808 | $100,133 | $18,900 | $81,233 |
| 2020 | $8,444 | $95,365 | $18,000 | $77,365 |
| 2019 | $8,888 | $98,589 | $18,000 | $80,589 |
| 2018 | $8,690 | $95,632 | $18,112 | $77,520 |
| 2017 | $8,421 | $88,140 | $16,693 | $71,447 |
| 2016 | $8,066 | $83,545 | $15,823 | $67,722 |
| 2015 | $7,784 | $77,357 | $14,651 | $62,706 |
| 2014 | -- | $72,979 | $13,822 | $59,157 |
| 2013 | -- | $75,236 | $14,249 | $60,987 |
Source: Public Records
Map
Nearby Homes
- 109 Old Post Rd
- 129 Seton Creek Dr
- 201 Grays Dr Unit 4
- 521 Waterford Dr
- 122 Longbeach Rd
- 404 Kent Ct
- 604 Berkshire Ct
- 135 Chesterfield Dr
- 34 Sonora Dr
- 86 Circle Dr E
- 27 Winrock Rd
- 19 Wyndham Dr Unit 10
- 209 Huntington Ct
- 16 Afton Dr
- 307 Huntington Ct
- 215 Fernwood Rd
- 16 Spring Garden Dr
- 28 Seneca Dr
- 4 Barclay Ct
- 253 Bluegrass Pkwy
- 203 Mondovi Dr
- 300 Barnaby Dr
- 302 Barnaby Dr
- 200 Mondovi Dr
- 205 Mondovi Dr
- 202 Mondovi Dr
- 304 Barnaby Dr
- 204 Mondovi Dr
- 306 Barnaby Dr
- 207 Mondovi Dr
- 129 Old Post Rd
- 206 Mondovi Dr
- 303 Barnaby Dr
- 209 Mondovi Dr Unit 3
- 308 Barnaby Dr
- 208 Mondovi Dr
- 305 Barnaby Dr
- 211 Mondovi Dr
- 310 Barnaby Dr
- 210 Mondovi Dr
Your Personal Tour Guide
Ask me questions while you tour the home.